Trend Following Strategy|Build and Backtest Your Rules
Trend following sounds simple—ride the move. But the edge is in how you judge the trend and where you exit. This guide covers reading trends, entries and exits, and how to write your strategy rules two ways—as a discretionary read and as numeric conditions—then backtest them into your own style.
In 8 Core Trading Strategies Explained, the first strategy on the list was trend following. Trade in the direction of the prevailing trend—buy when it's rising, sell when it's falling. Put into words, that's all it is.
But try it and you'll see. "Is a trend actually in place right now?" "Where do I get on?" "When do I get off?" Each of these calls for a judgment, and that's where results diverge. Because it's simple, without your own rules you can end up buying the top when you meant to ride the move, or bailing early on a trend that had room to run.
This article is about how to read trend following as a strategy, and how to make it your own through backtesting. At its core, it shows—concretely—how to write this strategy into ENTRIQ's strategy rule field, in two patterns: a discretionary read and numeric conditions.
Up front, the views and indicators here aren't "the right answer." They're common approaches laid out neutrally; which one fits you is something to confirm through backtesting.
What trend following is
Trend following means entering in the direction of a move that's already underway. It's also called "going with the trend."
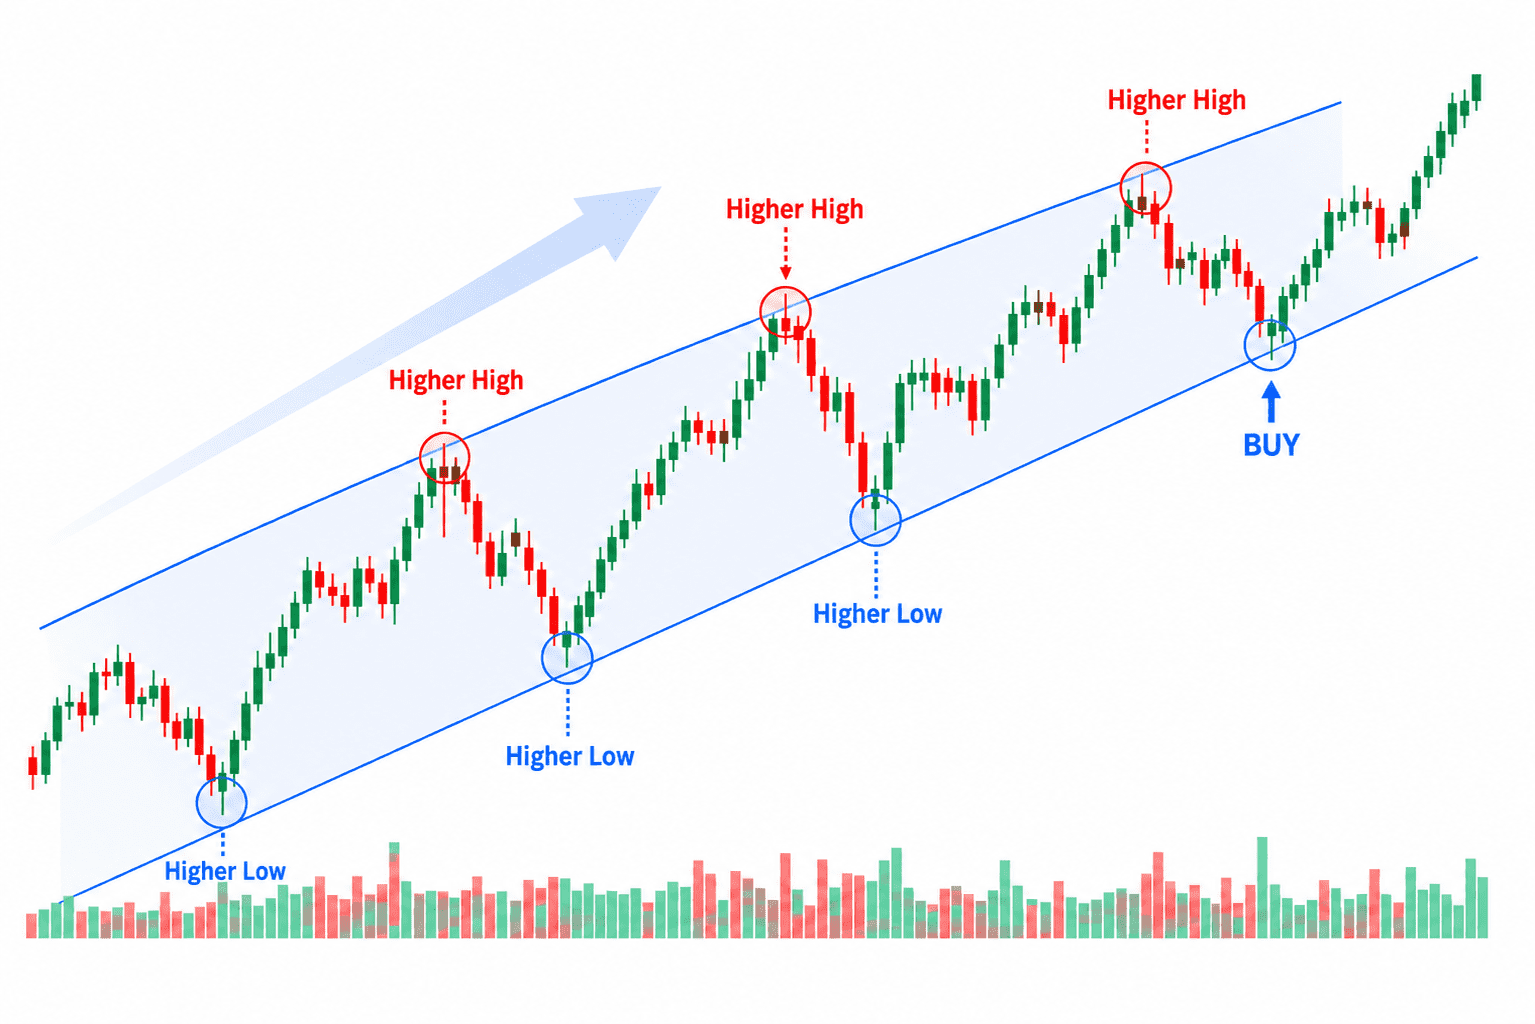
At its root is an observation: markets that start trending often continue in the same direction for some time. While that tendency holds, trend following rides the move to aim for profit.
Its counterpart is mean reversion (counter-trend), which aims at the reversal of an overextended move. If trend following "follows the flow," counter-trend "fights the flow." Neither is superior—they simply look at different things.
The appeal of trend following is that if you catch a large move, profit can grow the longer you hold. The difficulty is that the "start" and "end" of a trend are hard to see while you're in it. Often, by the time a trend is obvious, the move is already well along; and by the time you notice the trend has ended, the pullback has already begun. This "difficulty of timing" is exactly what backtesting is for.
Why confirm it through backtesting
Reading about trend following and nodding along won't translate into your own trading. There are two reasons.
One is that there's no single right way to read a trend. Some people read it with moving averages, some with higher highs and higher lows, some with trendlines. On the same chart, the timing at which each view calls a trend "in place" differs. Which view fits your instinct and your target symbol is something you can't know until you actually try.
The other is that a rule can only be tested over many repetitions. Whether "buy the pullback in an uptrend" works isn't something one or two tries can tell you. Only after dozens of attempts with the same rule does a tendency—"with this rule, this kind of situation comes up often"—start to show. Doing this on the live market would take months of testing alone.
This is where chart replay helps. With past charts, you can test trend-following rules with no risk, and many times faster than live. Chart replay itself is covered in detail in What Is Chart Replay? How to Practice Stock Trading on Past Charts.
Reading the trend: common views
The first hurdle in trend following is judging whether a trend is in place. Here are the common views, laid out neutrally. Each has trade-offs, and many traders combine them.
| View | The idea | Watch out for |
|---|---|---|
| Higher highs and higher lows | Higher highs and higher lows read as up; lower highs and lower lows read as down | In a range, the highs and lows tangle and it's hard to judge |
| Moving averages (MA) | Read trend direction from the line's slope and the short / long relationship | In a flat phase the slope flips constantly |
| Trendlines | Connect lows or highs to visualize the slope of the move | How you draw the line is subjective and varies by person |
Let's look at each a little more concretely.
Higher highs and higher lows
An uptrend is a pattern of higher highs and higher lows; a downtrend is a pattern of lower highs and lower lows. It's the most basic, intuitive view, and one of the core ideas behind Dow Theory. Since you read the shape of the chart itself rather than an indicator, it's easy to take in by eye. In an uptrend, for instance, price takes out the prior high and the pullback low holds higher than the previous one—while both of those are true, you call the trend intact.
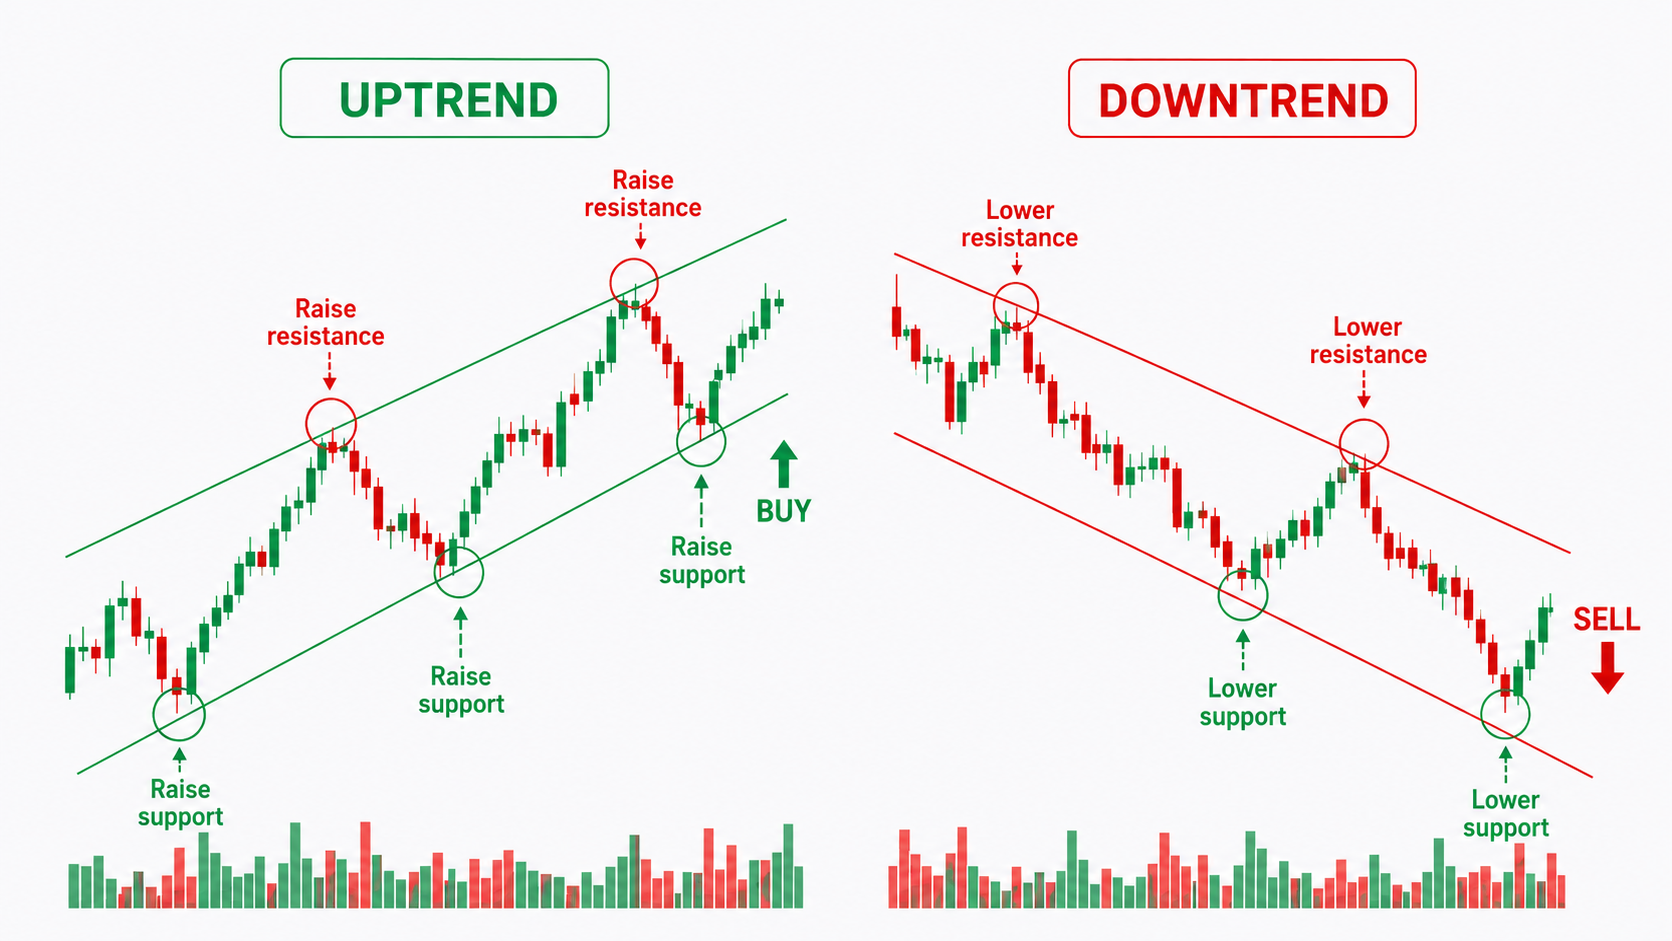
The catch is that in a range, the highs and lows tangle and the call gets hard. Some subjectivity also creeps into "what counts as a swing high or low," and picking up every little wiggle makes your read waver. In practice you need to set, for yourself, a granularity like "ignore pullbacks of this size," and whether that granularity fits your symbol and timeframe is something to confirm in backtesting. How you handle the moment a trend breaks (the first time a low steps down) also feeds directly into your entry and exit calls.
This way of reading higher and lower highs and lows is known as Dow Theory. For how to pick swing points and read a trend change, see Dow Theory Explained: Reading Higher Highs and Higher Lows.
Moving averages (MA)
A line of the average price over a set period; a rising line reads as up, a falling line as down. A common variation plots two lines—short and long—and reads the short above the long as an uptrend bias. It's easy to judge mechanically by number, and it captures the "direction" of a trend at a glance. In trend following, the MA's slope is often used as a first filter for "is this even a backdrop where I should be going with the trend."
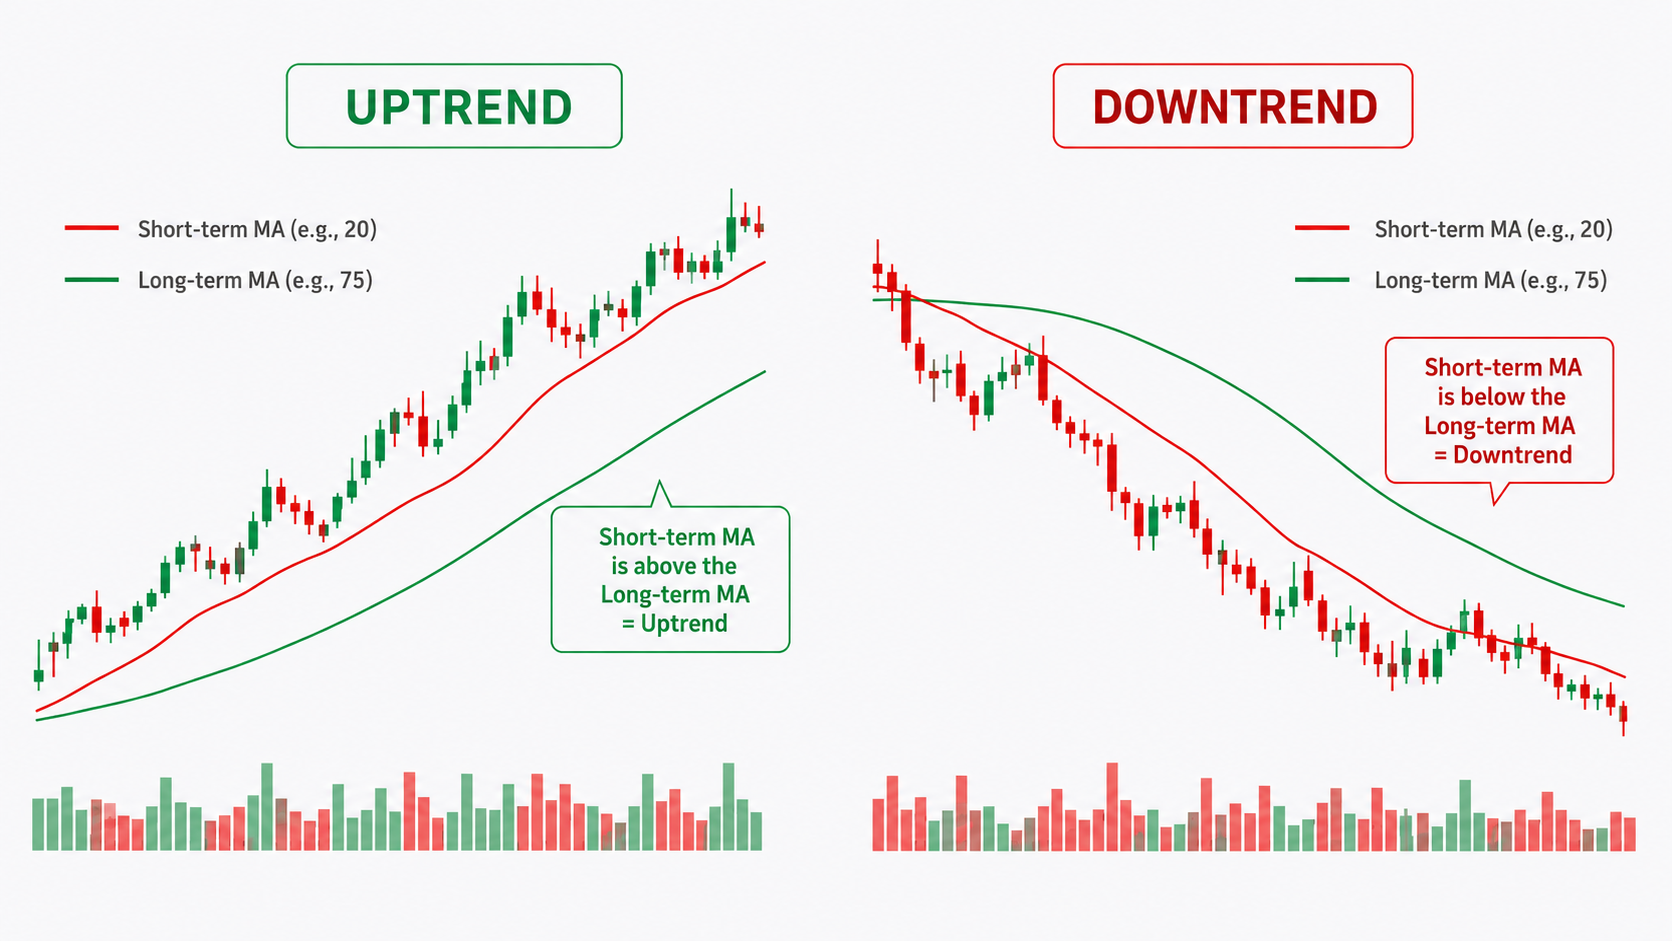
The catch is that in a flat phase the slope flips constantly and fakeouts pile up. Because an MA is the average of past closes, it also lags the turn of a trend. Using the MA as your axis for reading a trend—slope, crossovers, bounces—has enough to dig into that it's covered as a full article in How to Use Moving Averages. If you combine it with trend following, read that one alongside this.
Trendlines
A line connecting lows (in an uptrend) or highs (in a downtrend) to visualize the slope. While price moves along the line, the trend continues; break the line, and it's a sign of a possible turn. Unlike an MA, which is drawn automatically, you draw it yourself—so it makes the "angle" of the market easy to notice, and you can read the trend's momentum (whether the slope is steep or gentle) from it.
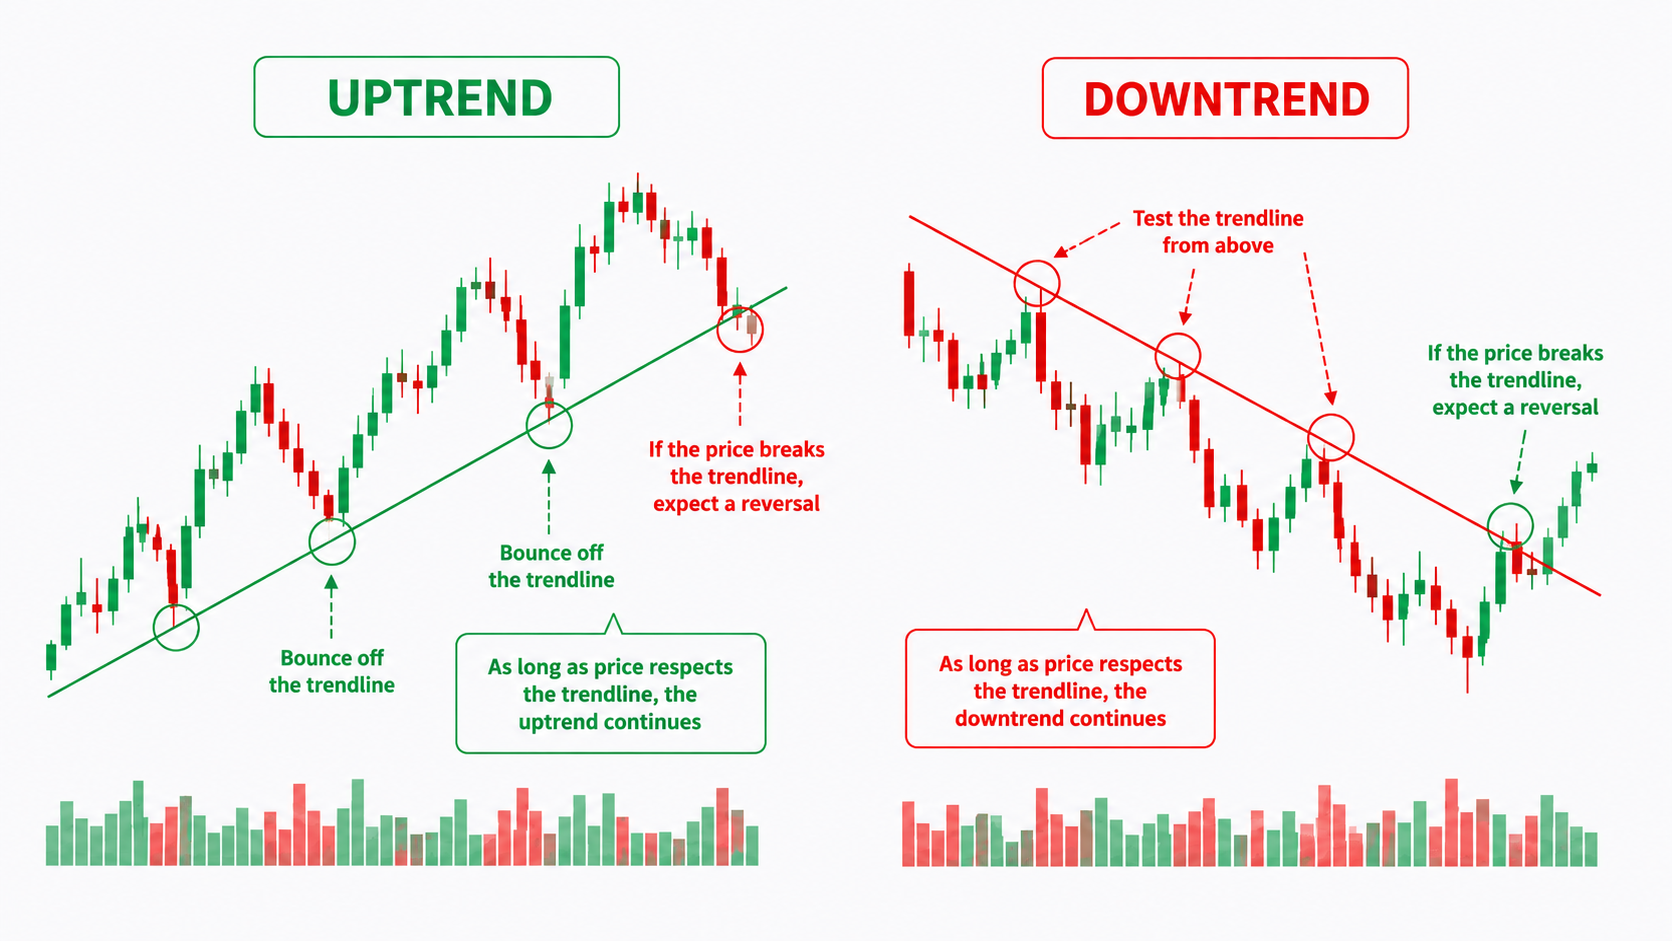
The catch is that how you draw the line is subjective. Which low you connect to which changes the slope, and the line's position shifts from person to person (or even each time the same person redraws it). So the "break the line, it's a turn" call also shifts in timing depending on how it's drawn. If you use trendlines, fix your own rule for drawing them (which lows to use), and get a feel through backtesting for "with that way of drawing, this is the kind of spot where it breaks."
Drawing trendlines is a deep topic on its own, so How to Draw Trendlines and Backtest Your Trading Rules covers it in full.
Every view has its "fakeouts." There will always be times you got on thinking a trend had formed, only for it to reverse. What matters isn't eliminating fakeouts—it's knowing, through backtesting, "with my rule, this is about how often fakeouts happen in this kind of situation."
Which of these to build around, or how to combine several—there's no single answer. The shortcut is to pick what you've tested repeatedly and feel "this keeps my judgment from wavering."
Entry: where to get on the trend
Even once you judge a trend is in place, there's the question of where to get on. There are broadly two approaches.
One is entering on a breakout—getting in at the point a trend accelerates, such as the moment price clears a recent high. It's easy to ride the momentum, but fakeouts (getting pushed back right after the break) are also more common. Entering on a breakout, including how to tell a real break from a fake one, is dug into as a full article in Breakout Trading Strategy.
The other is entering on a pullback—aiming at a temporary dip within an uptrend. If you assume the trend continues, you enter at a better price; but if that "dip" was the start of a trend reversal, you're straight into a loss. Including the judgment of how deep a pullback to wait for, it's covered in detail in Pullback Trading Strategy.
Neither is superior; it's something to confirm in backtesting—"which one can I judge more consistently?"
Exit: where to get off
What's surprisingly hard in trend following isn't the entry—it's the exit. Since a trend's end is only clear after it's over, getting off requires some kind of rule.
Exit on the trend breaking down. Get off when the basis you used to judge the trend breaks. If you judged the trend by a moving average, exit when price closes below that line. If you judged by higher highs and higher lows, exit when a low steps down. Because the rule is set together with the judgment, it stays consistent.
Exit on adverse movement (stop loss). Get off when price moves against you by a set amount, treating it as the trend read being wrong. In trend following, "the move I got on didn't continue" means the premise broke, so a stop loss fits this strategy well.
How to place the profit target. Hold as long as the trend extends, or get off at a set profit? This varies by approach. Since trend following's strength is "taking a lot when it runs," there's a view that taking profit too early erases that strength.
How to combine these is also territory to pin down in backtesting. If you set only the entry rule and leave the exit undecided, your results scatter and can't be evaluated. Rule the entry and exit as a set—that's the trick to making backtesting meaningful.
Writing it into the strategy rule field
Here's the heart of it. How do you actually write trend following into the "strategy rule" field of an ENTRIQ strategy tag? There are two broad approaches: a discretionary read (defining the situation in words) and numeric conditions (spelling out the conditions in numbers and indicators).
Neither is "correct." If you're good at reading the shape and flow of a chart by feel, the discretionary read suits you; if you want to set clear conditions and judge mechanically, numeric conditions suit you. Compare both and use whichever fits as your starting template.
Pattern A: Discretionary read (define it in words)
An approach that describes the look and situation of the chart in words. It doesn't get into indicator values; it fixes "what situation I enter in, and what situation I exit in" in your own words.
[Trend Following — Discretionary Read]
Context: First confirm the daily and weekly are both in an uptrend bias (a pattern of higher highs and higher lows). When the higher timeframe is down or sideways, stand aside.
Entry: After a temporary pullback within an uptrend, buy when price turns back up and a candle looks set to clear the prior high. Don't jump in on momentum alone—wait to confirm the "pull back, then resume" move before entering.
Stop: If price clearly drops below the recent pullback low, treat the premise as broken and get off.
Exit: Take profit when the pattern of higher highs and higher lows breaks and lows start to step down. As long as the trend continues, let the hold run.
Stand-aside conditions: Don't enter when the higher-timeframe direction is unclear, or when a large spike just happened and price looks to be in a high zone.
The strength of a discretionary read is that it flexibly takes in market context. You can include the "momentum" and "position" of a chart that don't show up in numbers. The weakness is that, with subjectivity involved, it wavers more easily from person to person (or even day to day for the same person). That's exactly why it's worth confirming through backtesting "how consistent my read actually is."
Pattern B: Numeric conditions (define it with indicators and numbers)
An approach that spells out entry and exit conditions in numbers and indicators as much as possible. It puts "enter / exit when this happens" into a form you can judge mechanically.
[Trend Following — Numeric Conditions]
Context: On the daily, take the 20-day MA above the 50-day MA (short MA above long MA) as the condition for trend continuation. When it's the reverse (20-day MA below 50-day MA), don't buy.
Entry: With the above met, wait for price to dip once to the 20-day MA and bounce, then buy on the close of a candle whose close is back above the 20-day MA.
Stop: Place it at entry price −2%, or below the recent pullback low, whichever is nearer.
Exit: Get off when a close drops clearly below the 20-day MA. Or, take half off when profit reaches +6% and hold the rest until a break of the 20-day MA.
Target / timeframe: Daily. One entry per symbol.
The strength of numeric conditions is high reproducibility. Because the conditions are set in numbers, anyone (including you, reviewing later) reaches the same judgment, making it easier to separate whether the scatter in results is "the quality of the rule" or "wavering judgment." The weakness is that it discards context the numbers don't capture. Precisely because the conditions are clear, it can mechanically meet them even in a situation you'd really rather stand aside from.
Note that the numbers here (20-day MA, −2%, +6%, etc.) are just sample entries. It doesn't mean these numbers are good—it's a model of "you can write at this level of detail." Find the numbers that fit your target symbol and timeframe through backtesting.
Tips for writing the strategy rule field
Common to both patterns: write out the entry, stop, exit, and stand-aside conditions, all of them. If you set only the entry and leave the rest blank, you can't trace "why this result happened" when you backtest.
It's also important not to aim for a perfect rule from the start. Write it once, run it through backtesting, and when you notice "this part was vague," rewrite it. The strategy rule field is a place to fix your rule—and at the same time, a place to grow it through backtesting.
The backtest-and-record flow
Once you've written the rule, run it through backtesting. The flow goes like this.
Open a past phase in chart replay, and make virtual entries and exits following your written rule. Each time, note why you got in or out in a trade memo, and attach the trend-following strategy tag. Repeat this, and across only the trades under that tag, the win/loss makeup, the tendency of profit and loss, the average holding period, and more get tallied automatically.
What matters here: don't take the numbers at face value while the sample is small. Deciding a rule's quality off 5 or 10 results leaves you at the mercy of chance skew. Only after enough repetitions does the tendency start to mean something. Recording and the use of strategy tags themselves are covered in detail in How to Keep a Trading Journal with Strategy Tags.
Accumulated records also become material for AI analysis. AI analysis is a feature that organizes observed tendencies in words, based on your past trade data and memos. It doesn't predict the future or recommend buys and sells—you use it purely as material to review "what tendencies my trend following has had in the past."
Common mistakes
Some patterns where trend-following backtesting tends to trip people up.
Going with the trend when no trend is in place. Repeating trend-following entries in a sideways range tends to mean buying the highs and selling the lows. Don't skip the context check—whether a trend is even in place.
Backtesting with no exit rule. Set only the entry and leave the basis for getting off undecided, and your results scatter and can't be evaluated. Deciding the exit as a set comes first.
Drawing conclusions from few attempts. Tossing a rule out as "no good" after a few tries is hasty. Backtesting is about the number of repetitions.
Changing the rule mid-backtest. Change the rule partway through and you lose track of what you were testing. Keep one rule for a set number of attempts, then improve after reviewing—draw that line.
Frequently asked questions
Q. Are trend following and buying the dip different things? Buying the dip is one entry method within trend following. Inside the larger strategy of trend following, "getting on at the trend's pullback" is buying the dip, and "getting on at the breakout" is breakout—that's the relationship.
Q. Discretionary read or numeric conditions—which should I write? Neither is correct. If you're good at reading a chart's flow by feel, the discretionary read suits you; if you want to set clear conditions and judge mechanically, numeric conditions suit you. Trying both and choosing whichever gives steadier backtest results is one way to go.
Q. Once I write a strategy rule, is it better not to change it? Better not to change it mid-backtest, but after running a set number of attempts and reviewing, you're free to rewrite it for improvement. The strategy rule field is a place to grow by repeating "fix and improve."
Q. How many backtests do I need before I can trust the results? There's no clear "this many," but 5 or 10 isn't enough. Only after enough repetitions to not be swayed by chance skew does a tendency start to mean something. With chart replay, you can rack up that count in a short time.
Q. What timeframe should I backtest on? Starting with the daily makes each bar's movement easy to follow and easy to backtest. As you get used to it, you can also backtest a multi-timeframe approach—confirming the trend on a higher timeframe while timing the entry on a lower one. Viewing daily, weekly, and monthly at once is covered in Multi-Timeframe Replay|See Daily, Weekly, Monthly at Once.
ENTRIQ is a chart replay, trading simulator, and backtesting platform for individual traders, integrating trade journaling and AI analysis. Supported markets include US stocks, FX, commodities, and crypto. Support for Japanese stocks is planned for a future release.
This article explains a trading strategy neutrally. It does not present any specific strategy, its results, or future profits. The numbers and conditions shown as entry examples are models for how to write, not a guarantee of effectiveness. Make investment decisions at your own responsibility.
Reproduce this validation yourself
With ENTRIQ's chart replay, you can trade through past charts using the same rules.
Start 14-day free trialValidate your method on past charts
The same validation in this article can be reproduced with your own method. On past charts, do the classics really work?
- ✓ Replay past charts
- ✓ AI feedback on your trades
- ✓ Validate methods with statistics