Review Your Trades with AI Analysis|Find Your Tendencies
ENTRIQ's AI Analysis puts observed patterns from your past trade data and notes into words—not predictions or signals. Learn how to review by trade and by strategy tag, moving between a single decision and the broader pattern of a setup.
You've managed to log your trades. But the entries just pile up, and you're not sure how to review them—so you end up staring at the screen and moving on. Anyone who keeps backtesting or journaling long enough eventually hits the same wall: records accumulate, but you don't know what to do with them.
This article walks through how to use ENTRIQ's AI Analysis to make reviewing your own trade records easier, following the actual screens. Let's be clear up front: AI Analysis does not hand you trade signals or tell you "what to buy next." It exists to take your past trade data and notes and organize the patterns it observes into plain language. Every investment decision remains your own responsibility.
How to keep a trade journal in the first place is covered in How to Keep a Trading Journal with Strategy Tags. This article is the next step: how to actually read the records you've built up.
What AI Analysis Is
AI Analysis takes the trade data you've logged—P&L, holding period, maximum unrealized gain/loss, and other auto-calculated figures—together with your trade notes, and has the AI organize, from your past trade data and notes, the tendencies it observes into plain language.
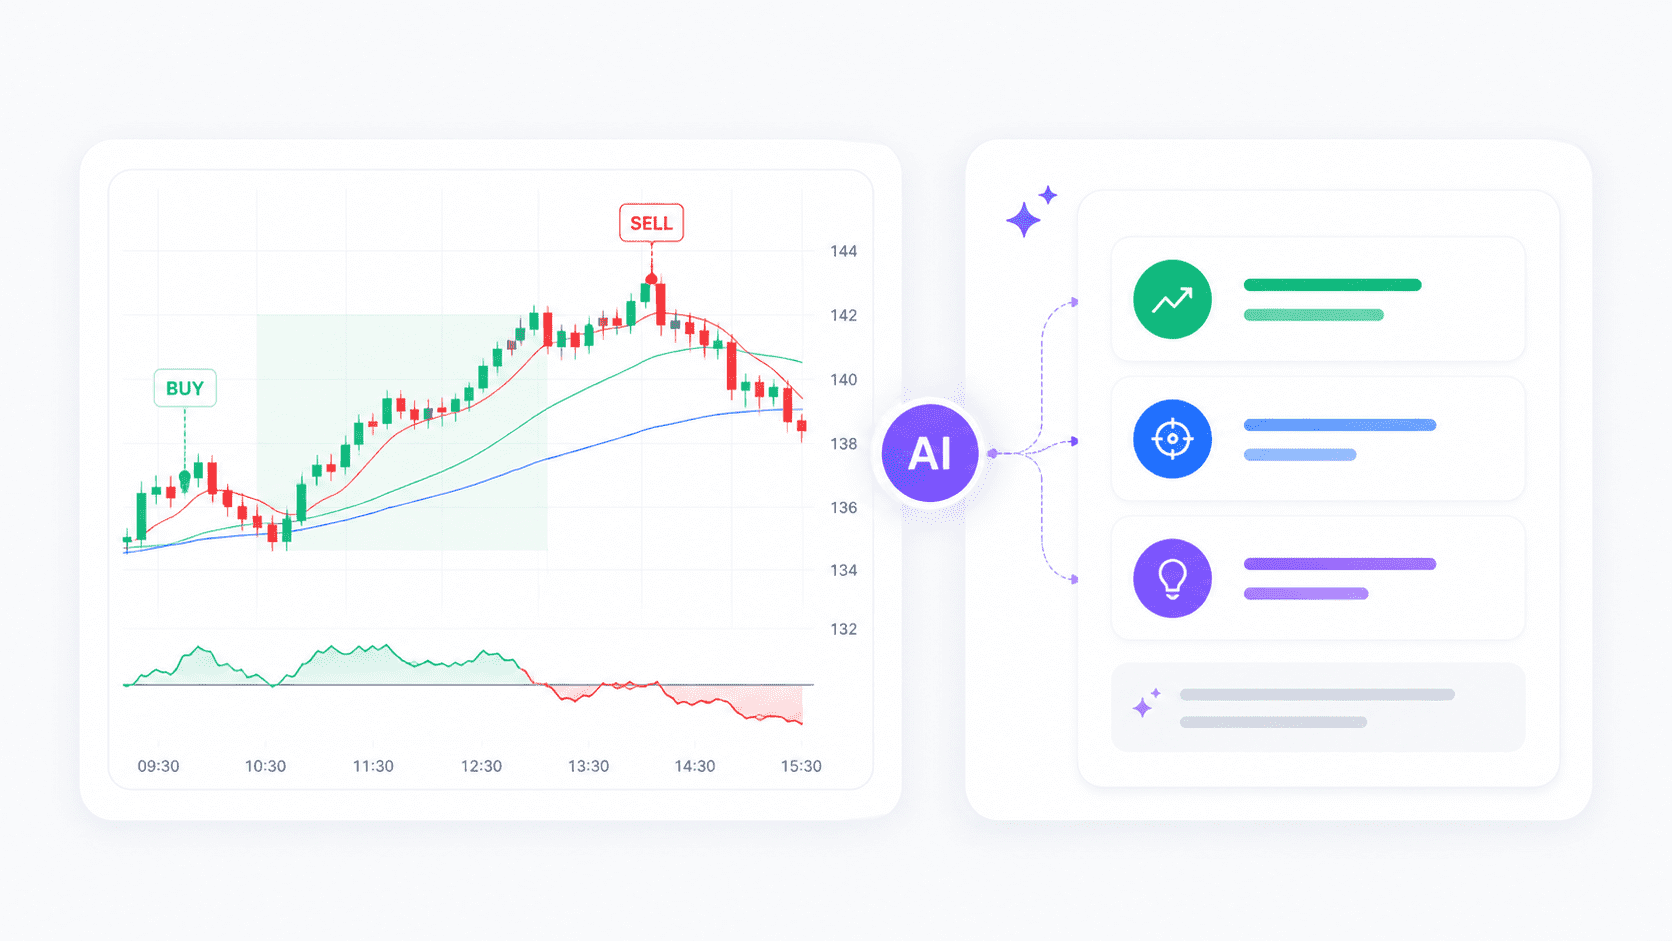
The key point: this is about organizing the past, not predicting the future. AI Analysis does not:
- call which symbol will go up or down next
- guarantee that "this setup will be profitable"
- issue buy or sell timing signals
Instead, it surfaces patterns that are hard to spot on your own—things like "the longer the holding period, the more your results scatter," or "the word 'rushed' keeps showing up in your notes"—and lays them out for you.
AI Analysis isn't a tool that hands you the answer; it's a tool that gives your review a place to start. The goal isn't to take its output at face value, but to use it as a starting point for your own thinking—to let it prompt a "now that you mention it, maybe so" and rethink things with your own head.
How It Differs from Reviewing in a Notebook or Spreadsheet
You can absolutely review trades in a notebook or a spreadsheet. In fact, a careful written review in a paper journal has real value of its own, and AI Analysis isn't here to dismiss that.
The difference is how much of the manual grind it removes.
| Notebook / Spreadsheet | ENTRIQ AI Analysis | |
|---|---|---|
| Aggregating numbers | You calculate and total it yourself | Auto-calculated (win rate, PF, average RR, etc.) |
| Spotting tendencies | You compare and notice on your own | Observed tendencies presented in words |
| Reading your notes | You reread them yourself | Tendencies organized using your notes as material |
| Staying consistent | Heavy effort makes it easy to drop | Less aggregation effort to keep up |
The number one reason reviews don't stick is usually the friction—"aggregating is a chore," "rereading is a hassle." When you can hand off the number-crunching and the pattern-organizing, you're freed up to focus on the part that actually matters: "so, what am I going to do about it?"
AI Analysis Works on Two Levels
ENTRIQ's AI Analysis operates at two scopes: the trade level, where you drill into a single trade, and the strategy-tag level, where you look at one setup as a whole. Moving between the two lets you review from both the dots (individual trades) and the line (the overall performance of a setup).
Trade-Level Analysis
On an individual trade's review screen, you can analyze that one trade on its own. The screen lays out auto-calculated figures such as:
- invested amount, realized P&L, holding period
- maximum unrealized gain, maximum unrealized loss
- risk-reward ratio
It also charts cumulative P&L and unrealized P&L (max unrealized gain and loss), so you can see at a glance how far a position ran in your favor and where you actually closed it.
If you've left a trade note in your own words, the "Run AI Analysis" button analyzes that single trade on its own (each run consumes one credit). Your reason for entering, your timing on the exit, the emotion you wrote down in the note—it uses all of these as material and organizes what stood out in that trade.
When you put a "fact in the numbers"—the unrealized gain ran a long way but you closed for a small profit, or the maximum unrealized loss was deep—next to "what you felt at the time" from your note, your decision-making habits start to show. AI Analysis helps put that side-by-side into words.
Strategy-Tag-Level Analysis
In ENTRIQ, you attach one strategy tag to a trade to sort it by setup. Open a strategy tag's analysis screen and you get results aggregated across only the trades carrying that tag.
A tag like "Breakout FX," for example, shows figures calculated from that tag's trades alone:
- win rate, total P&L, profit factor
- average risk-reward ratio, average holding period
- maximum drawdown, longest winning / losing streak
- expectancy, recovery factor, P&L standard deviation
- P&L distribution (count by P&L bracket)
- cumulative P&L curve, win rate by day of week
From there, "Ask AI" in the top right or "Update Analysis" in the AI Analysis section organizes the broader pattern of that tag as a whole. The strength of the tag level is catching setup-level patterns that a single trade can't reveal—"a high win rate but small average gains," or "the losses cluster on a particular day of the week." This is the central way to run AI Analysis on your own trading journal in ENTRIQ.
Each strategy tag also has a field for writing out a "strategy rule," and the "Analyze Rule" button can organize that rule itself. When a setup is only vaguely articulated, the review wobbles too—so this is usable from the very stage of writing and tightening the rule.
AI Analysis Gets More Valuable as Records Grow
AI Analysis has more material to observe the more you record. A handful of trades won't reveal a tendency, but keep logging consistently under the same strategy tag and patterns gradually become easier to see—"the kinds of situations where profits tend to run," "where your judgment tends to waver."
Put the other way: while your trade count is low, the analysis runs thin because the material is thin, and the output tends toward the generic. That isn't a limit of the analysis—the material simply hasn't accumulated yet. Building up records and notes day by day is what raises the resolution of the analysis. Rather than rushing to a conclusion off a few trades, keep recording and watch the tendencies emerge—that's the premise for getting value out of AI Analysis.
What the Review Loop Actually Looks Like
A review built around AI Analysis roughly follows this flow:
- Log a trade and attach one strategy tag (see the separate article for how to journal)
- Leave a trade note on it (why you got in, why you got out, what you felt)
- Run trade-level AI Analysis and check what stood out in that one trade
- Once you've accumulated enough trades under the same tag, run strategy-tag-level analysis to see the broader pattern of the setup
- Read the organized tendencies and decide on just one thing to try next
The crucial part is keeping step 5 to just one. Trying to fix many things at once doesn't last. Pick the single point from the AI's output that bothered you most, test it in your next round of backtesting, log it, and review again—keeping this small loop turning is what stops reviewing from becoming busywork.
Things to Keep in Mind When Using AI Analysis
Finally, a few things worth holding onto as you use AI Analysis.
1. The analysis is about the past What AI Analysis organizes is the tendency of trades that have already happened. It's not a "here's what comes next" prediction. There's no guarantee a tendency will continue, so use it as one input for future decisions—on the premise that you'll rethink it with your own head.
2. Thin data and notes make for thin analysis AI Analysis works from the data and notes you've recorded. With too few trades, or notes left blank, there isn't enough material to organize, and the output tends toward the generic. The notes you accumulate day to day translate directly into the quality of the analysis.
3. It is not investment advice To repeat: AI Analysis is not a buy/sell recommendation or signal. Acting on its output as an investment decision is yours alone to do—and yours alone to be responsible for.
FAQ
Q. Is AI Analysis a buy/sell signal or recommendation? A. No. AI Analysis is a feature that takes your past trade data and notes and organizes the patterns it observes. It is not a forecast or a trade recommendation. You are solely responsible for your own investment decisions.
Q. What's the difference between trade-level and strategy-tag-level? A. The trade level is a lens for drilling into a single trade; the strategy-tag level is a lens for viewing the trades under one setup (tag) together. You switch between them to review from both the dots (individual) and the line (the setup as a whole).
Q. What do I need to run AI Analysis? A. A trade record to analyze, and ideally a trade note. A trade-level analysis consumes one credit per run. The richer your data and notes, the more concrete the organized output becomes.
Q. Can I use AI Analysis without writing notes? A. You can run an analysis on the numbers alone, but a note lets it draw on "what you were thinking at the time," which gives the review more to work with. Even a short line capturing your reasoning or emotion helps.
Q. Is it better than reviewing in a notebook or spreadsheet? A. It's a difference in role, not in rank. A handwritten review in a notebook or spreadsheet has its own value. AI Analysis is a supporting mechanism that, by removing the manual grind of aggregating numbers and organizing tendencies, makes reviewing easier to keep up.
This article explains methods for reviewing trade records and does not guarantee the profit or results of any particular trading method. All investment decisions are made on your own responsibility.
Reproduce this validation yourself
With ENTRIQ's chart replay, you can trade through past charts using the same rules.
Start 14-day free trialValidate your method on past charts
The same validation in this article can be reproduced with your own method. On past charts, do the classics really work?
- ✓ Replay past charts
- ✓ AI feedback on your trades
- ✓ Validate methods with statistics