What Is Chart Replay|Practice Trading on Past Charts
A beginner-friendly guide to chart replay: replaying past charts one bar at a time to rehearse trading decisions in the market of the day — without real losses — plus how to keep the practice going.
"I keep making the same call in the same spot." If you've traded for a while, you've felt this. Taking profit too early, cutting losses too late, entering on a fuzzy rationale. Working through these in the live market takes far too long — and your capital gets chipped away in the meantime.
That's where chart replay comes in. You replay a past chart one bar at a time and rehearse, as many times as you like, how you'd have judged the market back then. This article walks through what chart replay is, why it's good for practice, how to actually do it, and the traps that are easy to fall into.
What is chart replay?
Chart replay is a feature that rewinds a past chart to a chosen point and lets you advance the candles one at a time, reproducing how you'd have judged the trade in the conditions of that moment. "Replay" means exactly that — playing the market back.
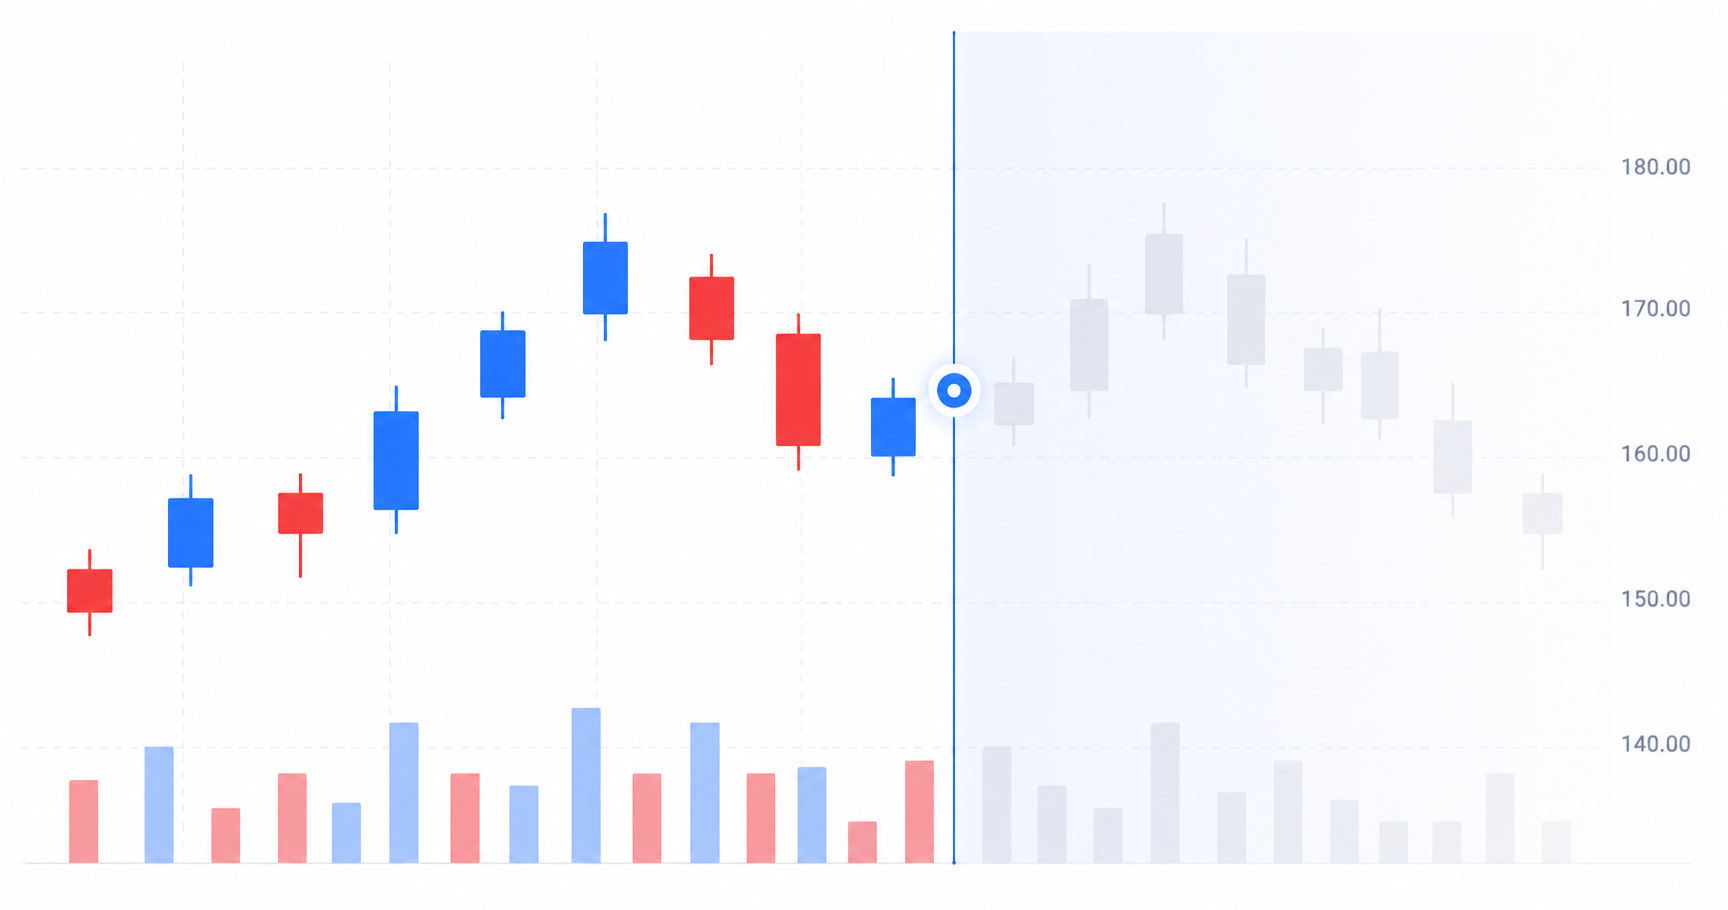
A normal chart shows the entire, already-completed price move from the start. That's an "I'd know the right answer in hindsight" state, which is no practice at all. Chart replay starts with the future candles hidden, and each time you hit "Next," one new candle is confirmed. In other words, you relive a past market under live-like conditions, without being able to see what's ahead.
The key point: in addition to the confirmed candles, you can also see the latest one currently forming (the forming candle). This reproduces the real-trading sensation of "judging while watching a candle that hasn't closed yet."
Why practice on past charts at all?
Getting better at trading is inseparable from racking up reps of decision-making. But in the live market, the entry opportunities that come up in a day are limited. Waiting for your setup to appear, it's not unusual to go weeks before you even meet the situation you wanted to test.
Historical backtesting on past charts has none of that constraint. With ten years of price action, you can pick out only the situations you want to test and repeat them as many times as you like. Want to drill "entering on a bounce off a decline"? Scroll back through past charts and you'll find similar spots over and over.
And practicing on past charts carries no real risk. You trade with virtual funds, so a wrong call costs you nothing real. You can confirm "what would've happened if I'd entered here" without losing money.
Personally, back when I kept repeating the same mistakes in my trading, the biggest wall I felt was that "you can only practice in the real thing." ENTRIQ's chart replay is the feature I built to remove that wall. If there's a place to rack up nothing but decision reps without losing money, I believe getting better should come a lot faster.
What you can do with chart replay
Here's what chart replay concretely lets you do.
You can advance the candles one at a time. "Next" moves you one bar forward, "Back" rewinds. You follow the gradual reveal of price action at your own pace.
You can test virtual entries and exits. Enter a "buy" or "sell" at any point, then close it while watching the price action that follows. You can specify entry price, quantity, and order type, and the P&L is calculated when you close. All funds are virtual, so your real account is never affected.
You can use multiple timeframes and indicators. Beyond daily, weekly, and monthly, some symbols support minute-level testing. You can replay with indicators like moving averages still displayed, so you practice in the same analysis environment you normally use.
How to get started with chart replay
Here's the basic flow of chart replay in ENTRIQ as an example. The underlying approach is broadly the same anywhere.
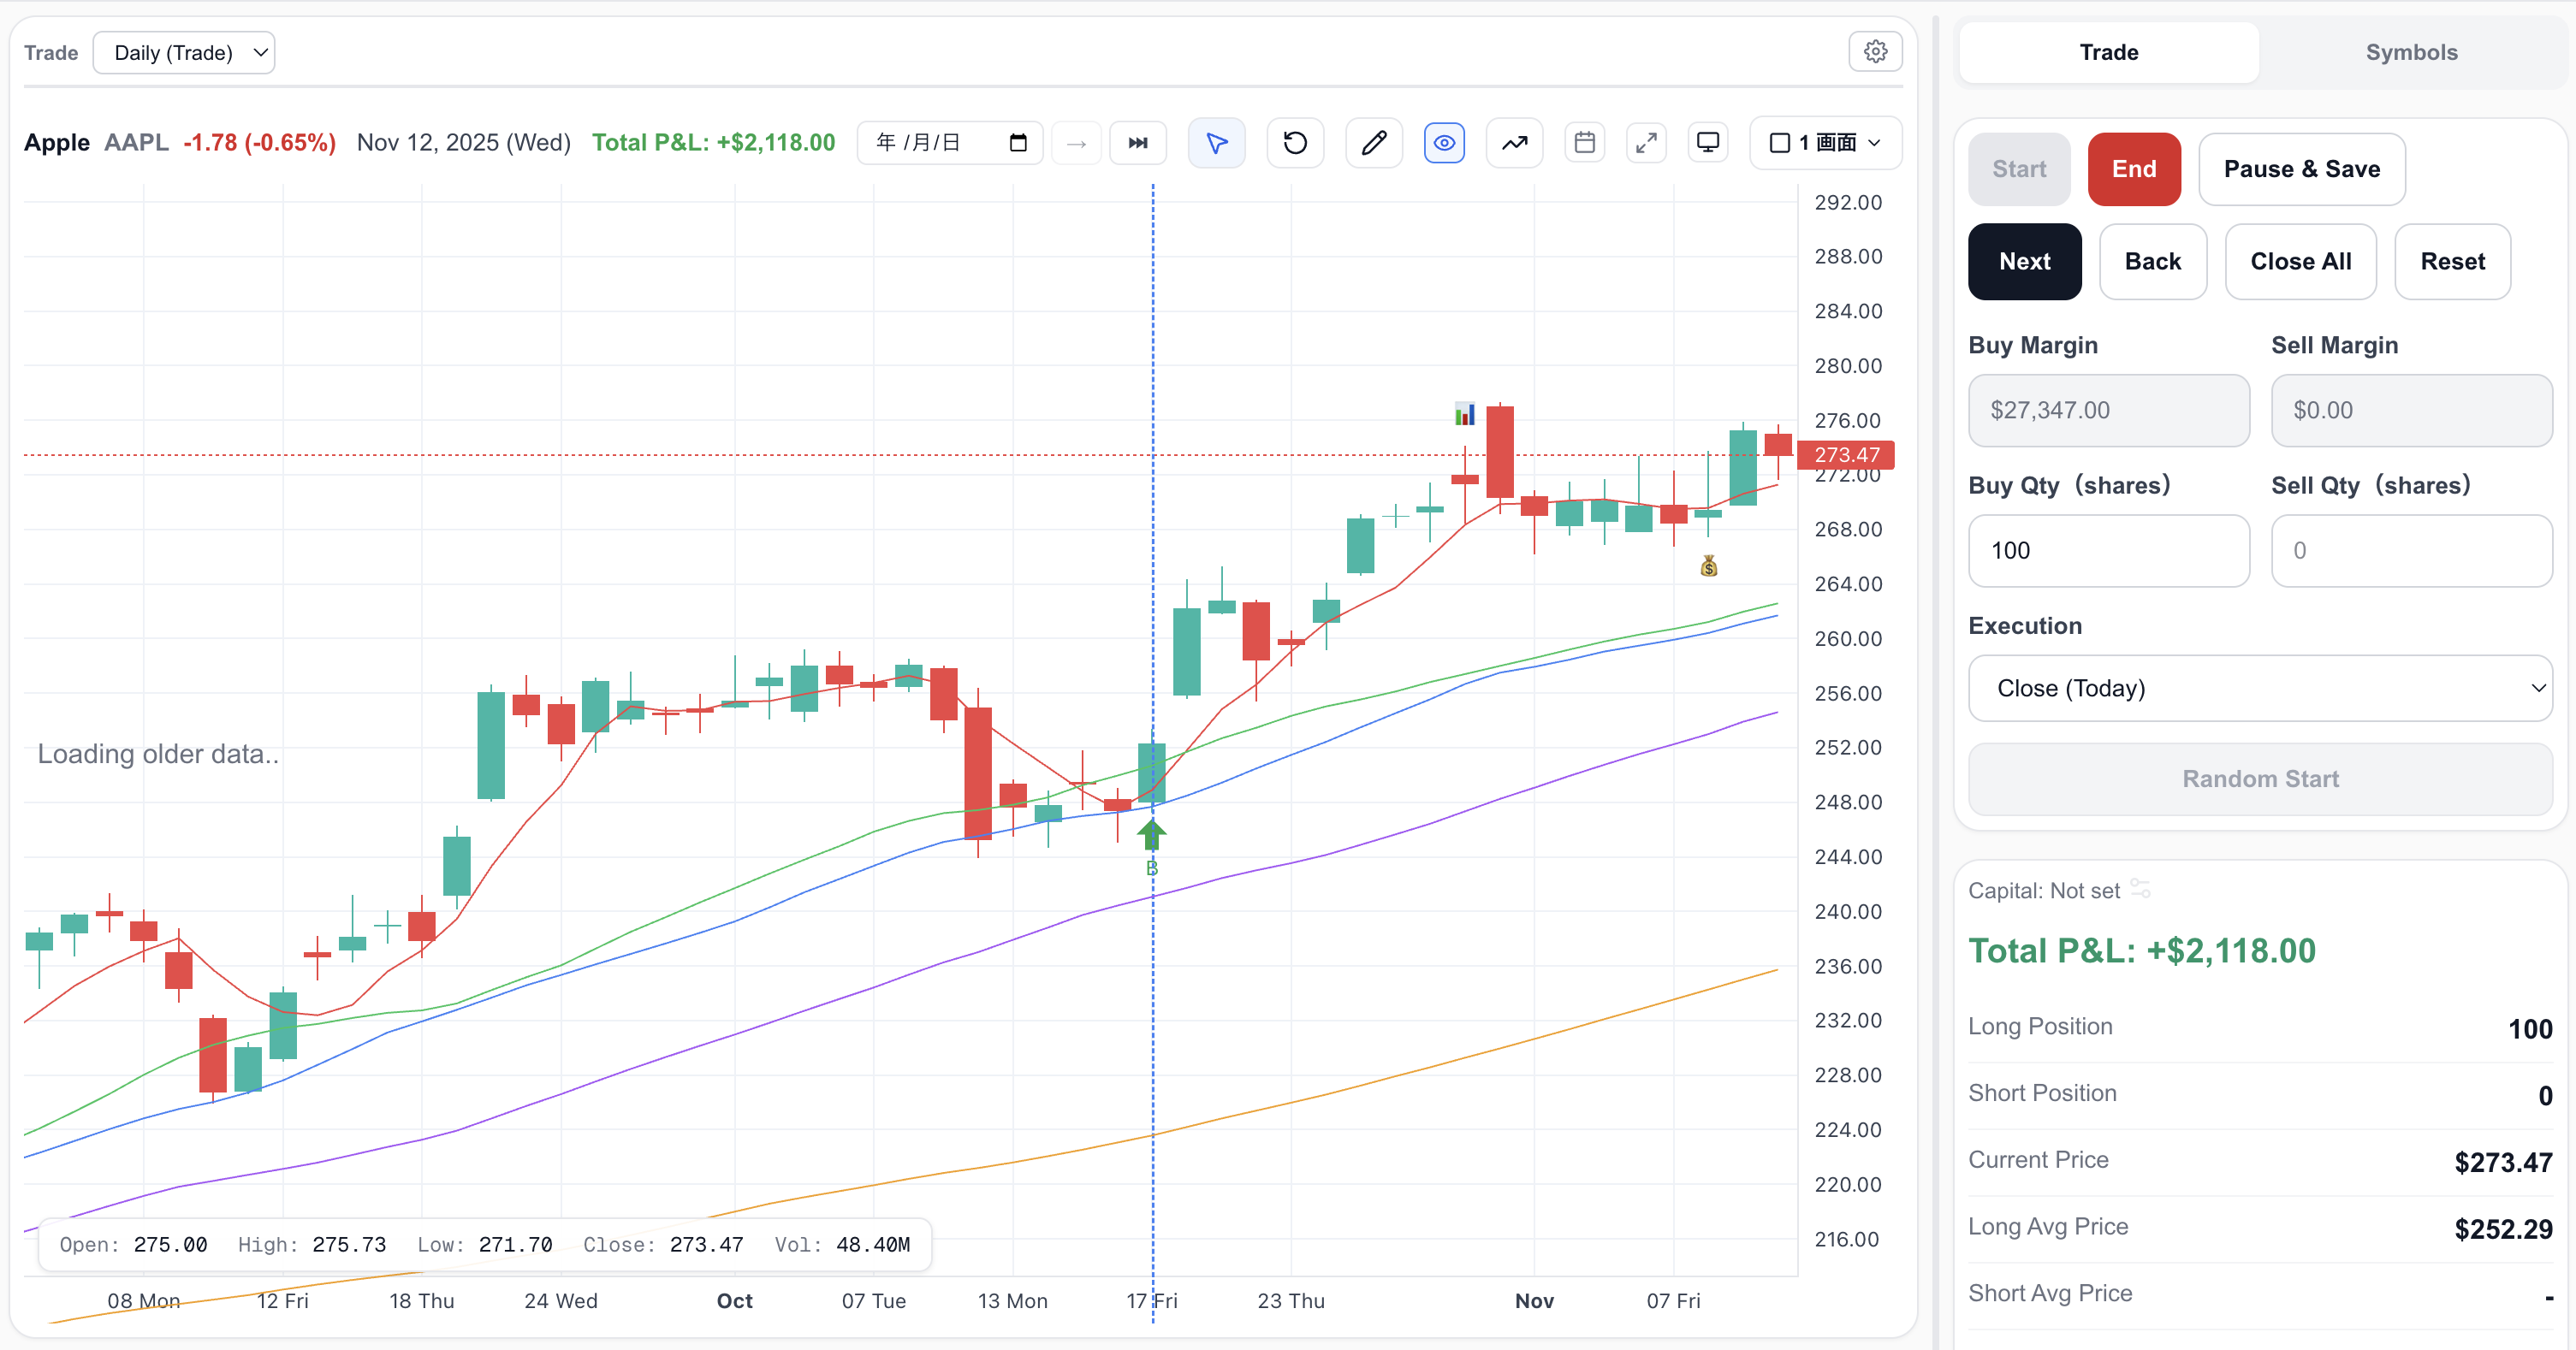
First, pick the candle where you want to start replaying. Think of it as setting the origin point: "I want to judge from this day forward without seeing what comes after."
Once the origin is set, press Start. The candles beyond that point are hidden, and the market is set to replay from that moment.
Each press of Next advances the chart by one candle, confirming new price action. When you want to reconsider, Back rewinds. As you go, you think through whether to enter or stand aside, just like in real trading.
When a spot you want to take arrives, place a virtual buy or sell entry. Specify quantity and order type, place the order, and you're now holding a position.
Follow the price action that follows with "Next," and close at the point you want to exit. Use Close All to flatten every position at once. When you close, you can check the P&L for that trade.
When you've finished a round, press End to leave replay. If a spot caught your eye, pick another origin and run it again.
How to practice and backtest with chart replay
Rather than just replaying and trading, building it up as backtesting changes the payoff dramatically.
What I recommend is naming your method and recording it. Decide on a pattern — say, "buy the pullback to the moving average" — then collect only the virtual trades of that pattern and review them. How many worked out of how many; is there a common thread in the ones that didn't? Stack up these reviews and your decision-making habits start to surface.
The goal of backtesting isn't to "hit the winning pattern" — it's to observe your own decisions objectively and distill them into a repeatable procedure. Think of chart replay as the means to safely rack up the reps for that.
In ENTRIQ, you can record these virtual trades by strategy tag and review them as statistics like win rate and average P&L. It's designed so you can run the cycle of testing by replay and reviewing by record. We'll cover how to keep records in detail in a separate article.
Common mistakes with chart replay
Chart replay is a powerful practice tool, but used wrong its effect is cut in half. Here are a few common traps.
First, sneaking a look at the price action ahead. The essence of the practice is "judging without seeing what's ahead." If you stop replay, glance at the chart ahead, and then decide, that's no longer practice — it's checking the answer key. Until you've made your call, it takes self-control not to look ahead.
Second, doing it once, feeling satisfied, and ending without recording. Just replaying and trading ends as "well, I did something," and doesn't carry forward. Only by repeating the same pattern, recording the results, and reviewing them do your habits become visible. Backtesting is about count, not a single run.
Third, testing random, different situations on a whim each time. Bounce plays today, breakout plays tomorrow — testing something different each time scatters your data and reveals nothing. Deciding "I'll test this pattern ten times" and intensively repeating the same conditions sharpens your judgment far more.
Fourth, remembering only the wins and letting the misses slide. People tend to remember successes, but what moves the needle is reviewing failures. Looking for a common thread in your misses yields far more learning.
Frequently asked questions
Q. What is chart replay?
It's a feature that rewinds a past chart partway and lets you advance the candles one at a time, reproducing how you'd have judged the trade in the market of that day. Because you practice without seeing the price action ahead, you can test under live-like conditions.
Q. Is there a tool for practicing stock trading?
Using a tool that replays past charts and lets you test virtual trades, you can practice without real losses. ENTRIQ is a stock practice and backtesting tool for individual traders, combining chart replay, trade journaling, and AI analysis in one place.
Q. Can beginners use chart replay?
Yes. You just press "Start" to begin replay and advance one bar at a time with "Next" and "Back," so the operation is simple. You test with virtual funds, so a mistake costs you nothing.
Q. Is there any point in practicing on past charts?
In the live market, the number of times you meet a situation you want to test is limited, but on past charts you can pick out similar situations and repeat them as many times as you like. The big advantage is safely racking up decision reps.
Q. What symbols can I practice on?
It varies by tool. ENTRIQ supports US stocks, FX, commodities, and crypto. Beyond daily, weekly, and monthly, some symbols also allow minute-level testing.
Summary
Chart replay is a feature that replays a past chart one bar at a time, letting you rehearse the trading decisions of that market as many times as you like. Its greatest value is racking up — without real losses — the reps that are hard to accumulate in live trading. Test by replaying, review by recording: running this cycle brings your decisions closer to a repeatable procedure. Don't look ahead, repeat the same pattern, and review the misses above all. Just keeping these three in mind changes the quality of your practice dramatically.
ENTRIQ is a stock practice and backtesting tool for individual traders, combining chart replay, trade journaling, and AI analysis in one place. From testing your decisions on past charts to reviewing them by strategy tag, you can do it all in one place.
Note: This service is not an investment advisory business. The information provided is reference information based on historical data. All investment decisions are your own responsibility.
This article is for informational and educational purposes only. It does not recommend any specific security or trading method, nor does it guarantee future price movements or profits. All trading decisions are your own responsibility.
Reproduce this validation yourself
With ENTRIQ's chart replay, you can trade through past charts using the same rules.
Start 14-day free trialValidate your method on past charts
The same validation in this article can be reproduced with your own method. On past charts, do the classics really work?
- ✓ Replay past charts
- ✓ AI feedback on your trades
- ✓ Validate methods with statistics