Multi-Timeframe Replay|See Daily, Weekly, Monthly at Once
Switching timeframes to check higher charts breaks your replay rhythm and causes missed levels. ENTRIQ shows daily, weekly, and monthly together, with the forming bars updating as you advance—plus when to use multi-panel versus multiple displays.
When you spend time backtesting, you keep hitting the same friction: checking higher timeframes. You're timing an entry on the daily chart and start wondering, "Where is this on the weekly? Am I getting close to a monthly level?" So you switch timeframes, check, and switch back to the daily. That round trip quietly breaks your rhythm.
Every switch drops the daily's context for a moment, leaving you to ask "where was I again?" And worst of all, you forget to check the higher timeframe at all and miss a key level — a classic cause of oversights in backtesting.
ENTRIQ offers two layouts that solve this: multi-panel and multi-display. Both let you view the daily, weekly, and monthly at the same time — keeping multi-timeframe analysis running without breaking the flow of testing — but which one fits depends on your setup. This article walks through the core value and how to choose between them, based on how the tool actually behaves.
If you're new to chart replay, start with What Is Chart Replay? How to Practice Stock Trading on Past Charts, then come back to this guide.
See daily, weekly, and monthly together, and advance them as one
The heart of this feature is simple: place multiple timeframes of the same symbol side by side, and when you advance the daily chart by one bar, the higher timeframes move with it.
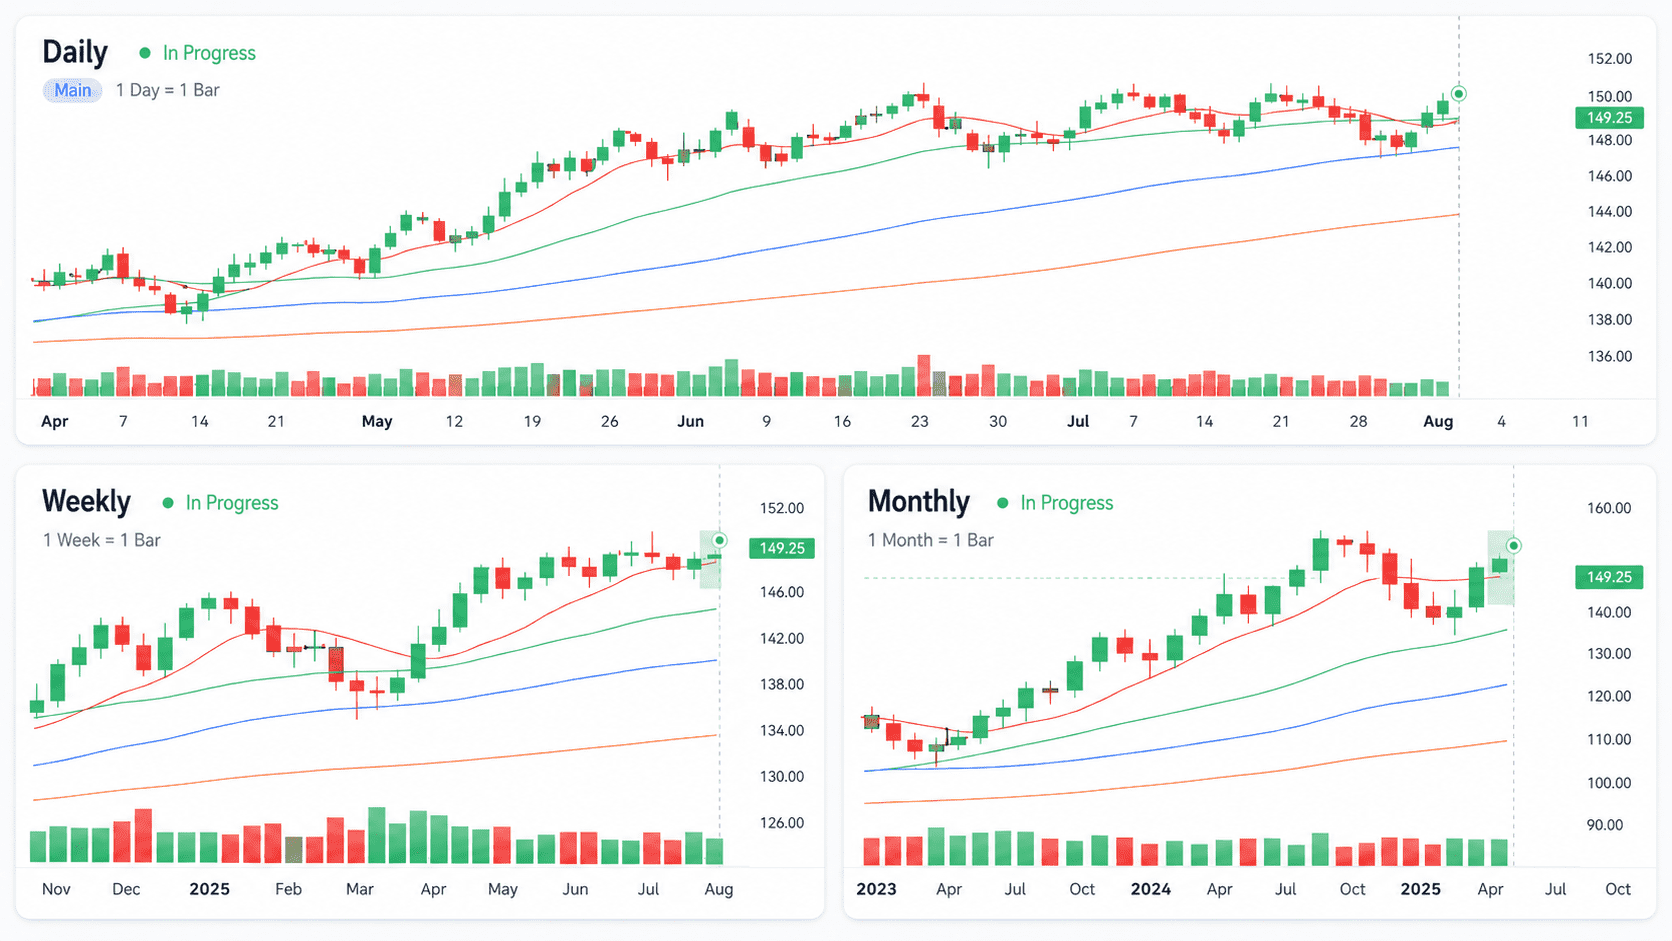
Say you line up the daily, weekly, and monthly. You advance the daily by one bar. The weekly and monthly advance to the same moment too. After five daily bars, exactly one weekly bar completes—and along the way, the weekly updates incrementally as a forming bar. The monthly forms the same way, in step with the daily's progress.
This is the key point. The most recent weekly and monthly bars are drawn in real time as forming bars—bars that haven't closed yet. This week's weekly is still in motion; this month's monthly is still growing. That "mid-formation" shape updates every time you advance the daily.
When you switch timeframes to check a higher chart, you lose the daily's context for a moment and risk missing a level when you forget to switch. Line up daily, weekly, and monthly and advance them together, and the switching disappears—and so do the oversights. You keep the higher-timeframe flow in view without breaking your rhythm.
This gives you three things. First, no switching: advance the daily and the weekly and monthly move at once, so the back-and-forth is gone. Second, more efficient multi-timeframe analysis: the time you spent switching and re-checking goes straight back into testing. Third, no missed levels: with higher timeframes always in view, you won't make an entry decision while a weekly or monthly level slips past you.
Forming bars create the "same view as live trading"
Why insist on forming bars on higher timeframes? To make the view in testing match the view in live trading.
In typical replay tools, higher timeframes often show only closed bars, and the forming bar is hard to see. So in testing you judge off a "cleanly closed weekly," while live you judge off a "weekly still in motion." The scenery differs between testing and reality.
In ENTRIQ, every time you advance a lower bar, the higher timeframes update as forming bars. So the weekly and monthly you watch while advancing the daily look exactly like what you see in real time when trading live. The instinct you build in testing—reading the shape of a higher bar mid-formation—carries straight into live trading.
For more on how this "closed bar + forming bar" approach is reproduced, see 5 Limits of TradingView Bar Replay for Serious Backtesting.
Multi-panel or multi-display: which to use
There are two ways to see daily, weekly, and monthly at once, and you choose by the number of monitors you have.
Multi-panel splits a single window into a grid to line up several timeframes. It supports up to a 4-way split (2×2). Since it fits on one monitor without opening extra windows, it suits a single-display setup—testing on one laptop, or working on the go.
Multi-display detaches a chart into its own separate window. Because it's a separate window, you can literally move it to another monitor. It supports up to triple displays, so it suits a multi-monitor setup.
The reason multi-display is recommended for multi-monitor setups is that each chart can be shown large. Multi-panel divides one monitor, so each chart inevitably gets smaller. With multi-display, you can use each monitor at nearly full screen, so the daily, weekly, and monthly all appear large, with even fine candles easy to read.
| Multi-panel | Multi-display | |
|---|---|---|
| Layout | Split one window (up to 4) | Detach into separate windows (triple) |
| Best for | Single display | Multiple monitors |
| Chart size | Smaller, divided | Large on each monitor |
| Timeframe sync | Yes | Yes |
| Different symbols | No | Yes |
Compare different symbols at the same moment (multi-display only)
So far this has been about viewing one symbol across timeframes. But multi-display has a second use: placing different symbols side by side and comparing them on a shared time axis.
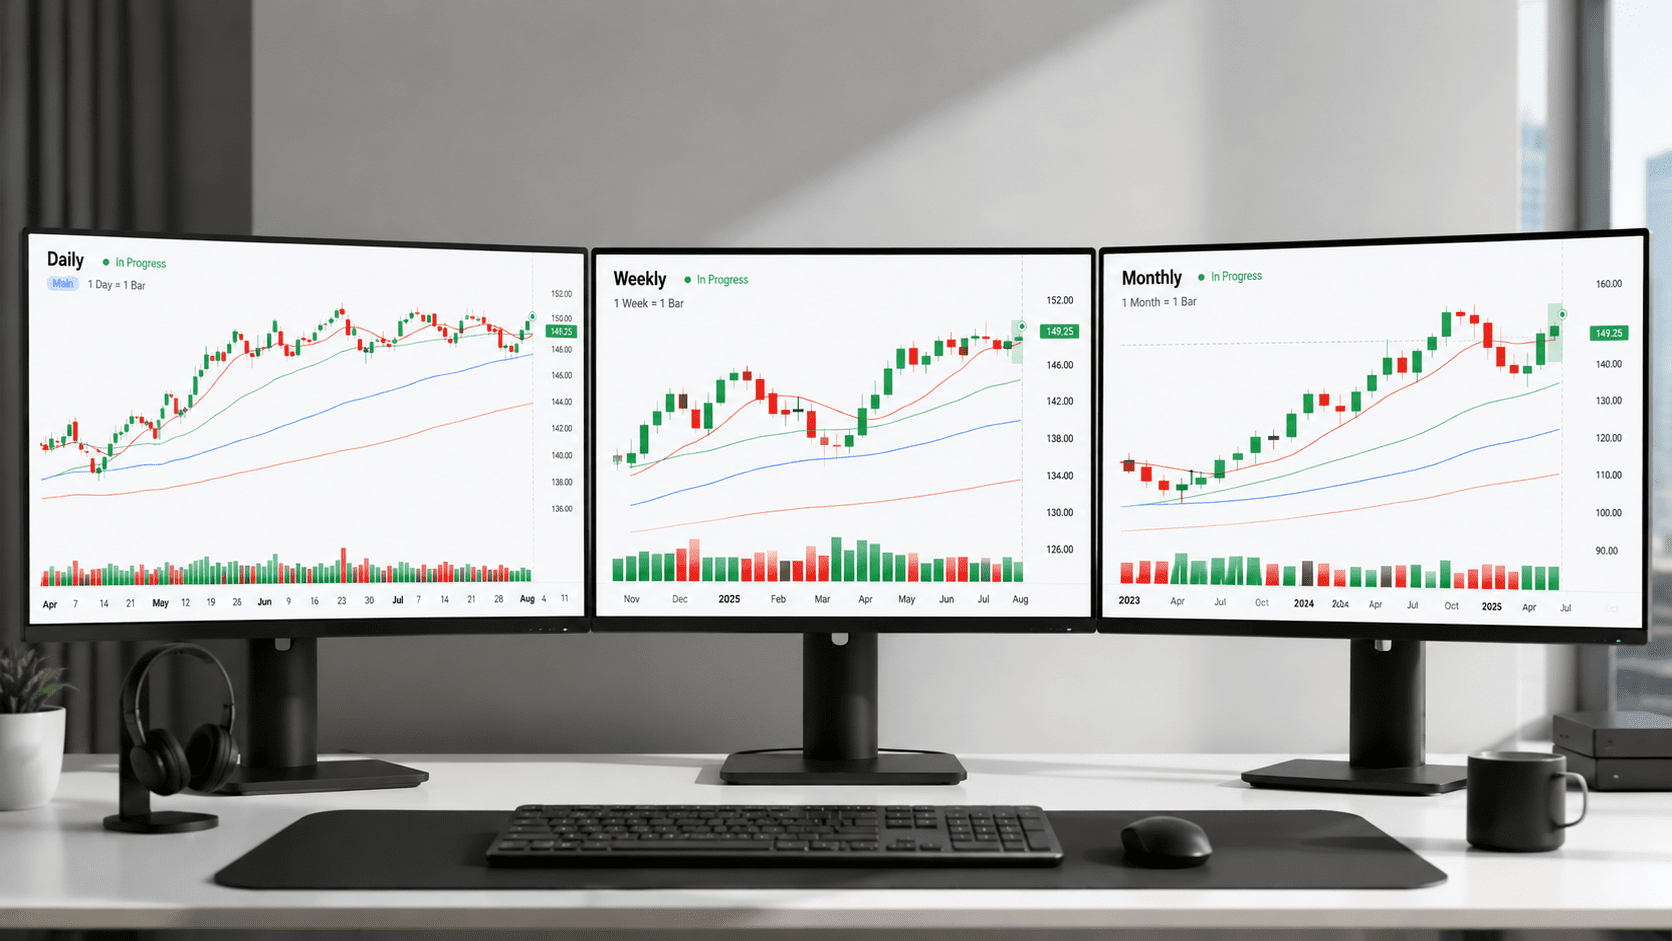
This is possible only with multi-display. Multi-panel specializes in timeframe sync for a single symbol and has no feature for lining up different symbols. When you want to compare different symbols, you use multi-display.
A detached sub-window can show a different symbol than the main. Advance AAPL on the main while you check MSFT or NVDA at the same moment on another monitor. The main window holds the lead on the time axis, so advancing a bar on the main moves the other symbols in the sub-windows to the same moment. Even with different symbols spread across monitors, you're always comparing "multiple symbols at the same moment."
The same market phase moves differently across symbols. In a phase where the index falls, one symbol follows obediently while another diverges and holds. You can observe that gap at once, with the time axis aligned—useful for checking sectors or correlation.
Note that forming-bar sync works here too. Advance a bar on the main, and the higher timeframes in the sub-windows on other monitors form just as they would live.
Record what you find
Once lining up daily/weekly/monthly—or different symbols—gives you an insight, don't let it end there. Move it into a record and it carries into the next session.
For instance: "It looked like a pullback on the daily, but the weekly's forming bar had a heavy upper wick." Or: "When the index fell, symbol A followed but symbol B diverged." Save insights like these as virtual entries and exits, attach a strategy tag, and later you can review only the trades under that tag across the board.
The how-to of recording is covered in detail in How to Keep a Trading Journal with Strategy Tags.
Common mistakes
First, adding too many panels and using none of them. When three—daily, weekly, monthly—are enough, adding more timeframes just creates information overload. Narrowing to the bars you actually judge on deepens your observation.
Second, getting confused trying to move the time axis on the sub side. The main window holds the lead on the time axis. It isn't a feature for moving time on the sub; it's a feature for viewing other timeframes or symbols on the time the main has set. Keep that in mind and you won't get lost.
Third, being satisfied by the layout and not recording anything. Even if you notice a gap with a higher timeframe or a difference between symbols, it won't help the next session unless you put it into words. Build the habit of moving at least one observation into a note.
Frequently asked questions
Q. If I advance the daily, do the weekly and monthly move too? Yes. With several timeframes of the same symbol lined up, advancing the daily by one bar moves the weekly and monthly to the same moment. The most recent bar on each higher timeframe updates in real time as a forming bar, so you can check it the same way you would live.
Q. Multi-panel or multi-display—which should I use? A single display suits multi-panel; multiple monitors suit multi-display. Multi-display can show each chart large on its own monitor, so it's easier to read in a multi-monitor setup.
Q. How is this different from TradingView's multi-chart layout? In ENTRIQ, advancing the daily updates the weekly and monthly forming bars in real time. And with multi-display, you can check different symbols synchronized to the same moment. Keeping multi-timeframe analysis running without breaking the flow of testing is what sets it apart.
Q. Can I line up different symbols in multi-panel? No. Multi-panel lines up multiple timeframes of the same symbol in sync. To place different symbols side by side, use multi-display.
Q. How many monitors does multi-display support? Up to triple displays. You can spread one symbol's daily, weekly, and monthly across three, or line up different symbols to compare.
Q. When I line up different symbols, what happens to the time axis? The main window holds the lead on the time axis, and the other symbols in the sub-windows sync to the main. Advance a bar on the main and the other symbols move to the same moment, so you're always comparing multiple symbols at the same instant.
You don't need to switch timeframes over and over just to check the higher charts. By viewing daily, weekly, and monthly together as you advance, you can read the flow of the whole market without breaking your testing rhythm.
ENTRIQ is a stock practice and backtesting tool for individual traders, integrating chart replay, trade journaling, and AI analysis. Supported markets include US stocks, FX, commodities, and crypto. Support for Japanese stocks is planned for a future release.
*This article explains how features work. It does not present any specific trading method, its results, or future profits. Figures shown on charts are examples for illustration. Make investment decisions at your own responsibility.
Reproduce this validation yourself
With ENTRIQ's chart replay, you can trade through past charts using the same rules.
Start 14-day free trialValidate your method on past charts
The same validation in this article can be reproduced with your own method. On past charts, do the classics really work?
- ✓ Replay past charts
- ✓ AI feedback on your trades
- ✓ Validate methods with statistics