8 Core Trading Strategies Explained
A neutral rundown of eight core trading strategies—breakouts, buying dips, fading moves, and more. Each comes with what it keys on, a sample strategy-rule entry, and how to make it your own through backtesting.
When you start trading, the first wall you hit is a simple question: what's your approach? You sit down to fill in a strategy tag or write out a rule, and realize you can't put it into words — because you don't yet know what styles are even out there.
This article is the map you start from. It lays out eight core trading strategies as neutrally as possible. For each one, you get what the style keys on and a sample of how it might read in ENTRIQ's strategy-rule field.
One thing up front: there's no ranking here, no "this one wins." Which style fits you depends on the person and on the market. So the goal isn't to memorize these — it's to take the ones that catch your eye, test them on past charts, and confirm what actually works for you with your own data. The detailed how-to for testing each style lives in its own dedicated article.
How to use this article
There are countless trading strategies, but grouping them into broad styles makes the whole landscape easier to grasp — especially when you're starting out. Below, we walk through eight core styles one at a time.
Each one comes with two things:
- What it keys on: where the style looks to make its call
- Sample strategy-rule entry: an example of how it might read in the "strategy rule" field attached to your ENTRIQ strategy tag
The strategy-rule field is where you pin your approach down in a single sentence. When the rule stays vague, your calls drift from trade to trade — so start by using the sample as a base and rewriting it in your own words.
One more note: these eight aren't mutually exclusive. In practice you combine them — buying the dip off a moving average, for instance. Understand each on its own first, then find your own blend through testing.
Each heading below ends with a link to the dedicated article that explores that style in more depth — if one catches your eye, head straight there.
1. Trend Following
What it keys on: Riding a market that's moving decisively in one direction — the trend. You buy in an uptrend and sell in a downtrend, entering with the flow rather than against it. The core idea: let the trade run as long as the trend holds, and step aside when the flow turns. Whether highs and lows are stepping up (or stepping down) is the usual read on whether a trend is even there.
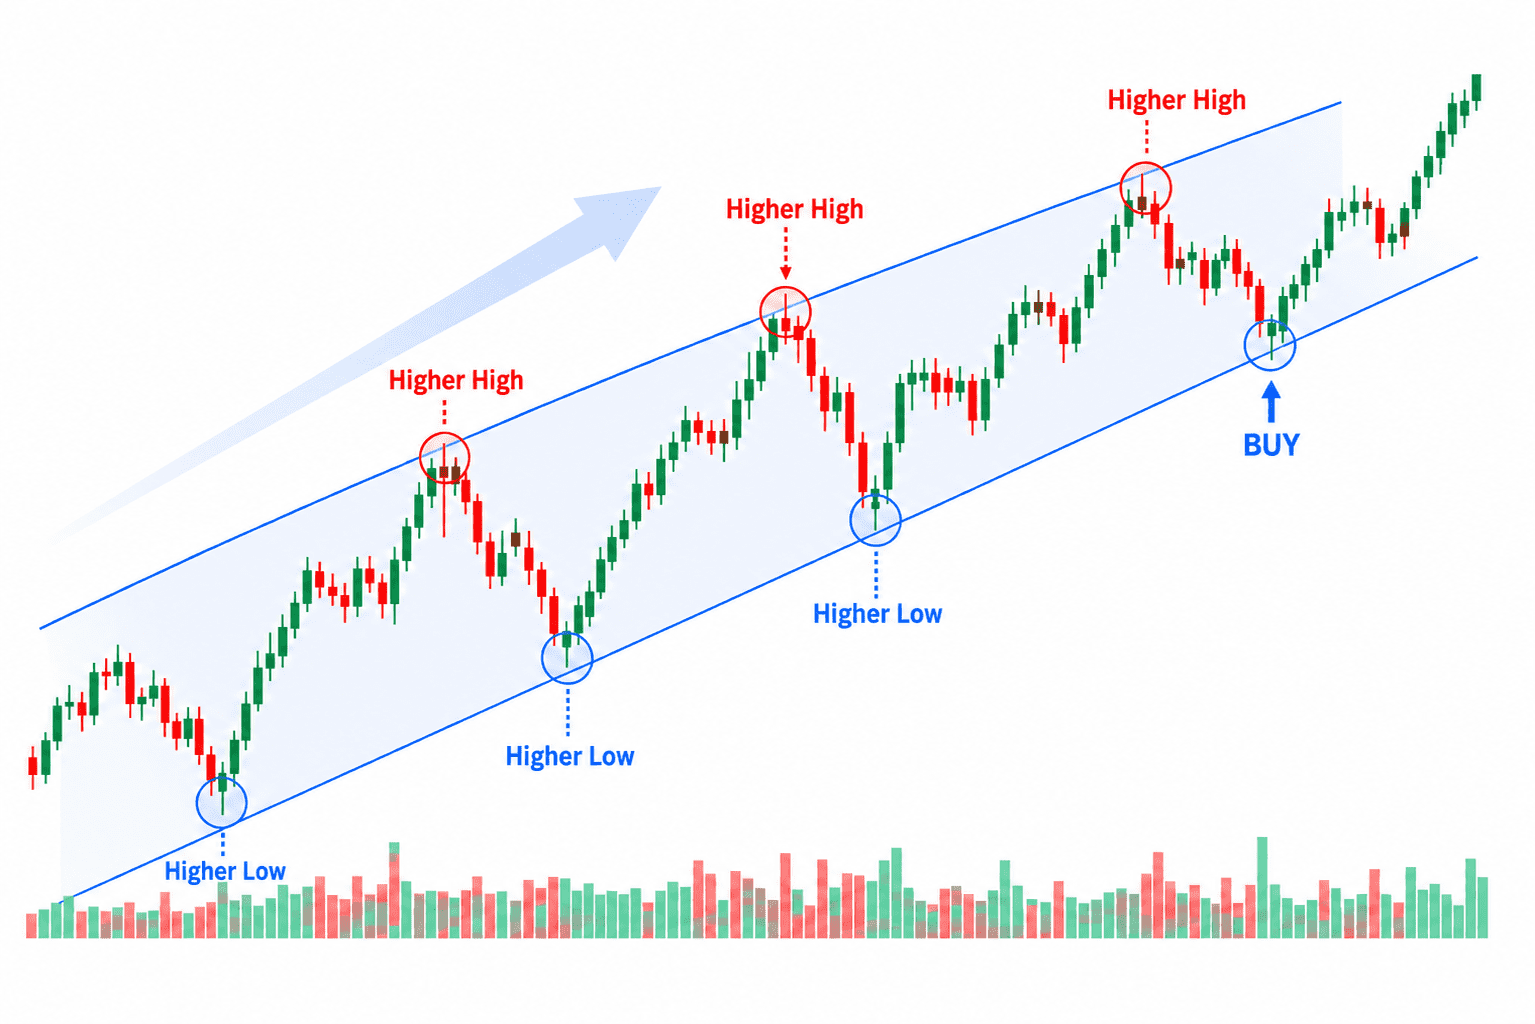
Trend following is the foundation under many other styles — breakouts and buying the dip, covered below, are both trend-following at heart.
Sample strategy-rule entry:
Only names where both highs and lows are stepping up. Buy when the most recent high is taken out. Exit when the most recent low gives way. No new entries while price is moving against the trend.
There's more than one way to read a trend and to spot when it's over, and which read fits you is something you find by testing it repeatedly on past charts.
▶ Go deeper into this style: Build Trend Following Through Backtesting
2. Breakout
What it keys on: Catching the moment price clears a level — a range, or a prior high or low — and accelerates in that direction. Clear the line that was capping the upside, you buy; break the line that was holding the downside, you sell. You enter in the direction of the break.
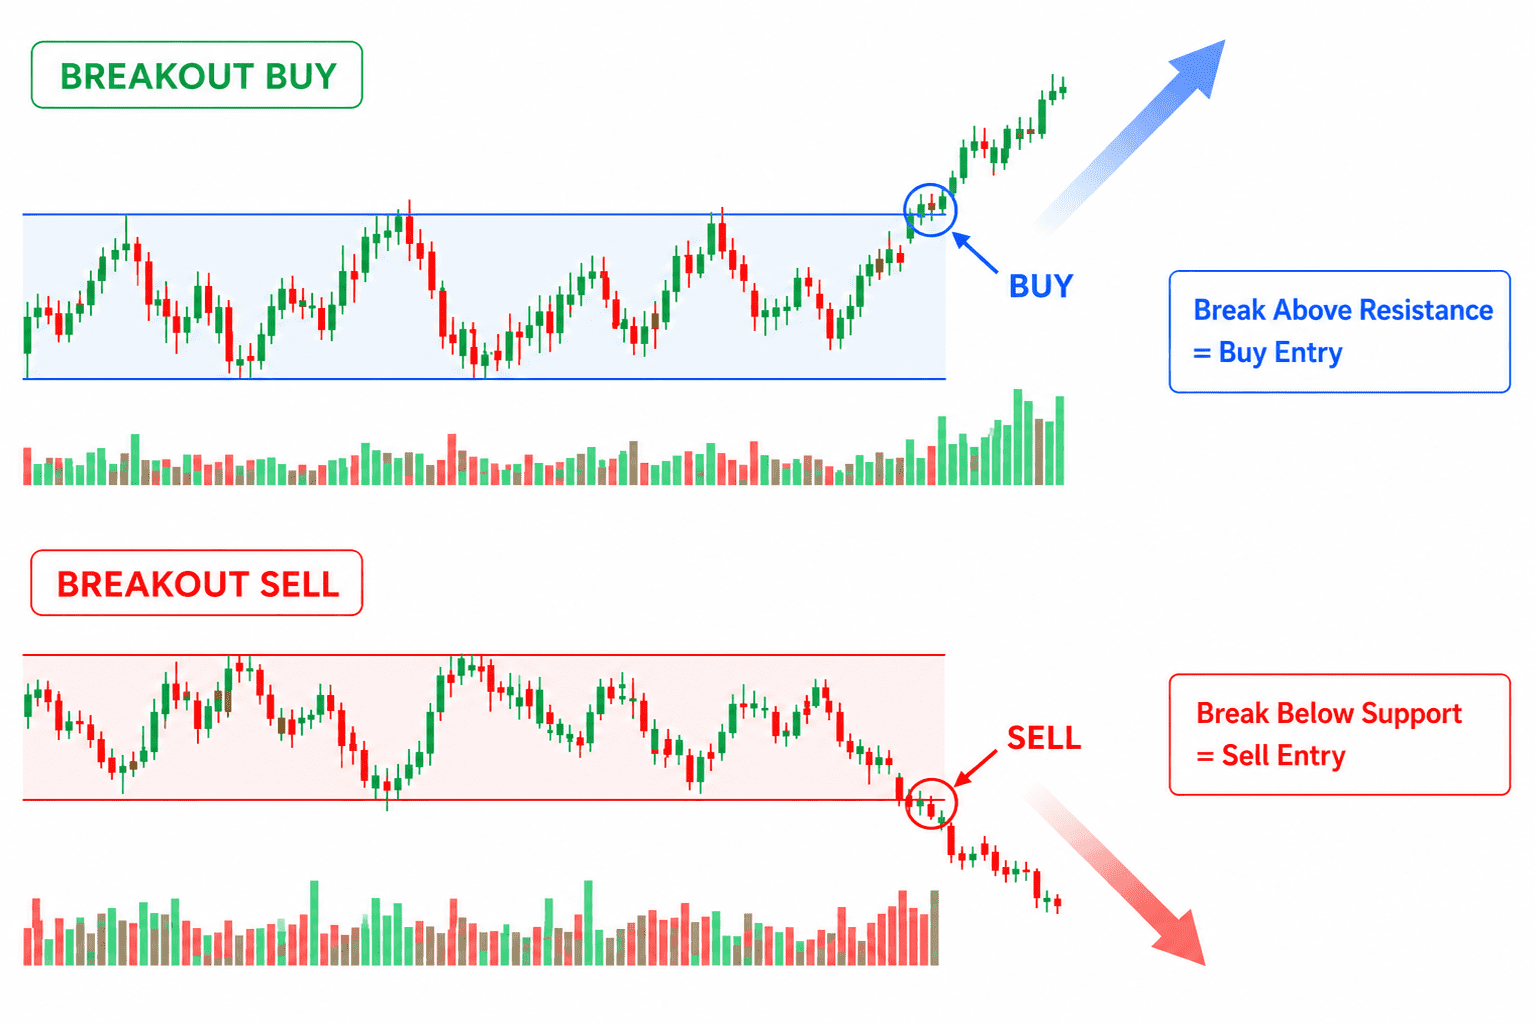
Sometimes momentum kicks in right after; sometimes price clears the level only to snap right back — the fakeout. How you handle fakeouts (waiting for the bar to close beyond the level, checking volume) tends to be the thing you test in this style.
Sample strategy-rule entry:
Buy when price closes above the high of the last 20 bars. Enter only after the breaking bar closes. Stop out if price closes back below the breakout level.
How a trend ends and how to confirm a clean break both reward testing on real charts before you trust them.
▶ Go deeper into this style: Breakout Trading Strategy|Spot Fakeouts, Backtest Your Rules
3. Buying the Dip / Selling the Rally
What it keys on: Keeping the trend direction but waiting for a pause in the counter-move — the pullback. You buy the temporary dip inside an uptrend, and sell the temporary bounce inside a downtrend. It comes from wanting to ride the trend without chasing the top or bottom.
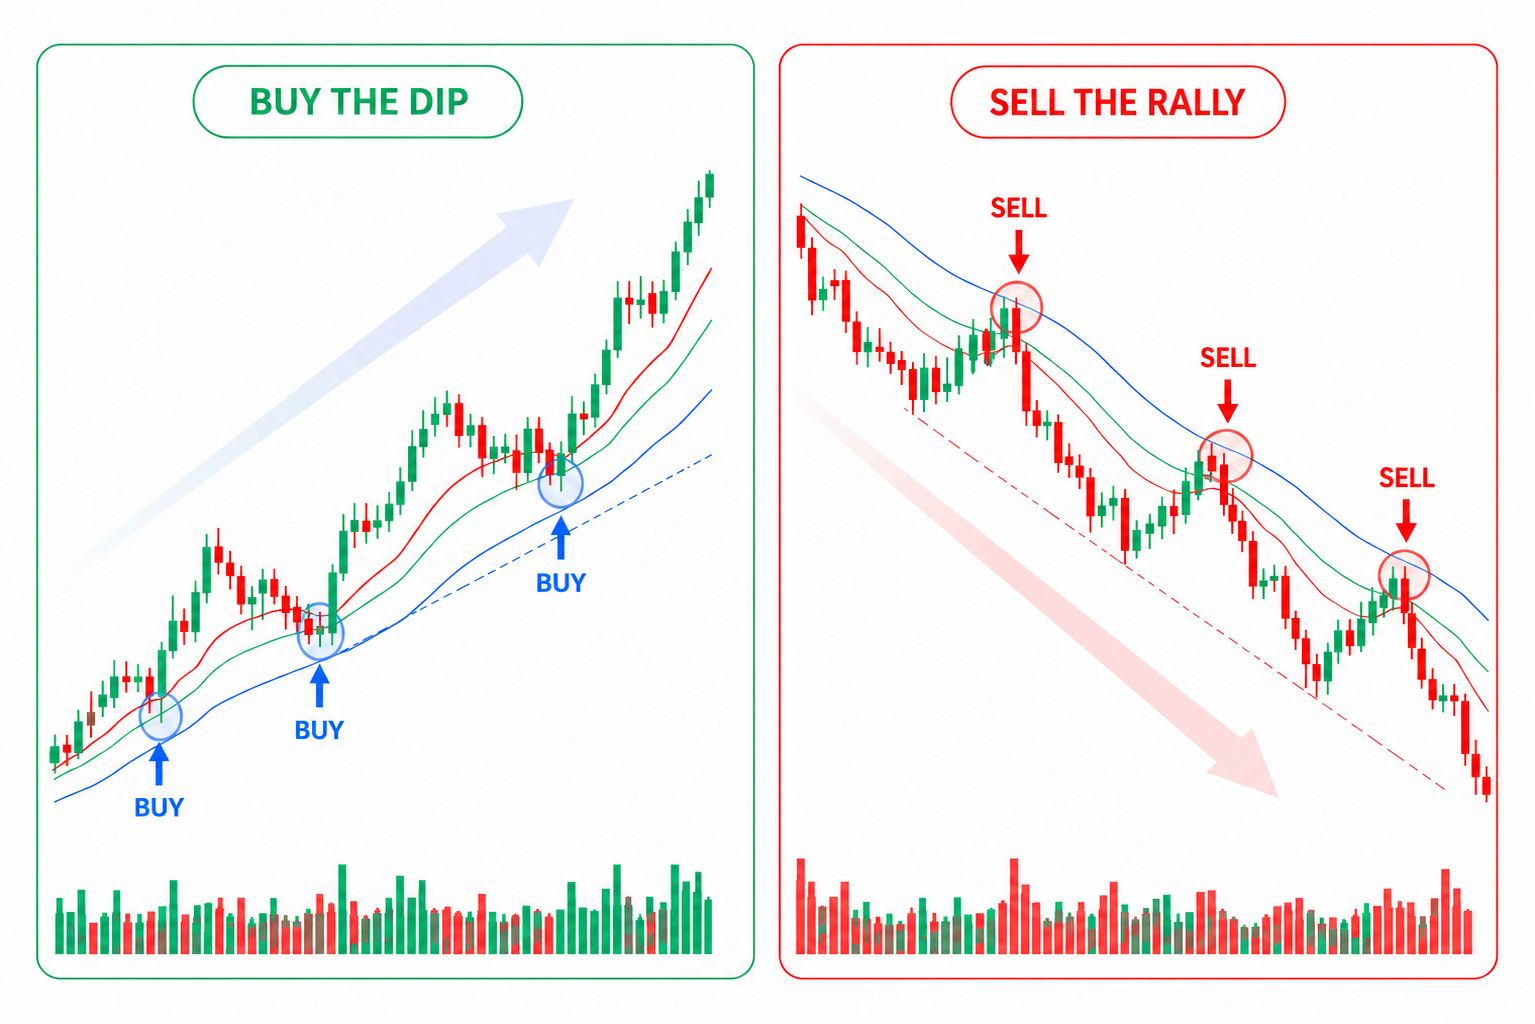
The fork in the road is "how deep a pullback still counts as a dip" and "how do I tell a dip from an actual trend reversal." It's often paired with a yardstick for measuring pullback depth — a moving average, Fibonacci levels.
Sample strategy-rule entry:
In an uptrend, buy when price pulls back to around the halfway point of the prior leg up. Skip the setup if the trendline is clearly broken.
Telling a healthy dip from a turning trend is exactly the judgment that sharpens with repeated testing.
▶ Go deeper into this style: Pullback Trading Strategy|Buy the Dip, Backtest Your Rules
4. Moving Averages
What it keys on: Using a moving average — the average of closing prices over a set period, drawn as a line — as your reference. Whether price sits above or below the line, the line's slope, and the order of multiple lines (where the short-term line sits relative to the long-term one) all read out the direction and strength of a trend.
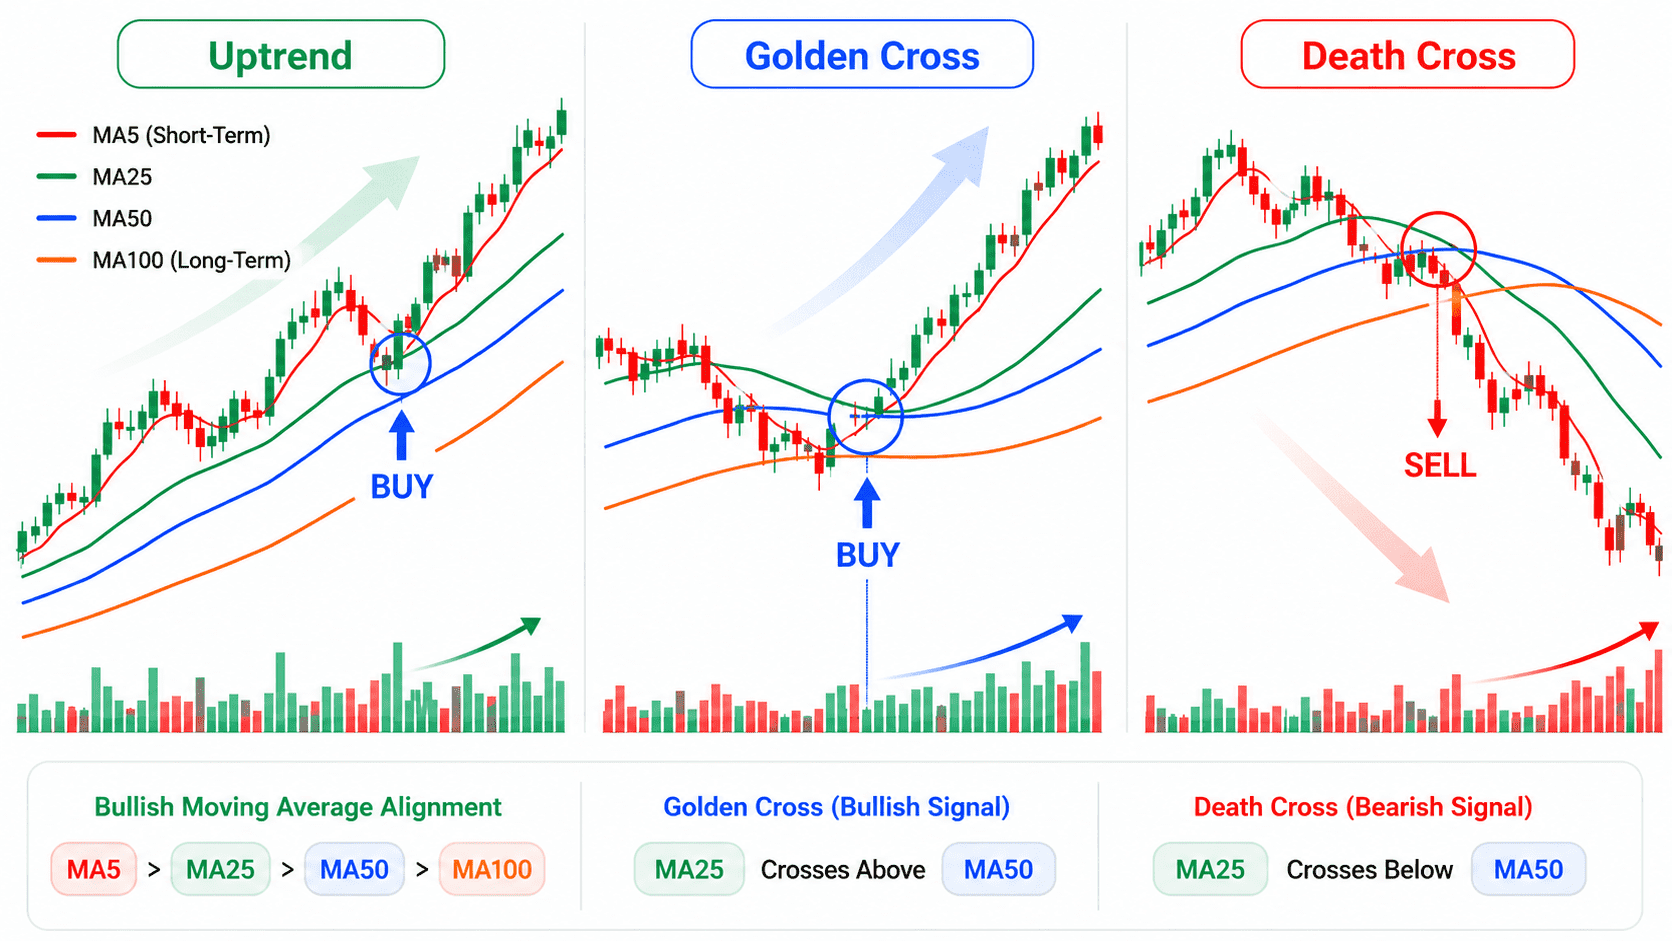
You can use price tagging the moving average and bouncing as your dip or rally, or treat a crossover of the short- and long-term lines (golden cross, death cross) as a turning point. Its range of application is what stands out.
Sample strategy-rule entry:
Only consider buys when price is above the 50-day moving average. Enter once price pulls back to the moving average and a bounce is confirmed. Exit if price closes below the moving average.
Which moving average settings suit your timeframe is something to settle through testing, not by copying a default.
▶ Go deeper into this style: Moving Average Strategy|Slope, Crossovers, and Backtesting
5. Mean Reversion (Counter-Trend Trading)
What it keys on: Catching the snap-back after price has run too far. Where trend following rides the flow, reversal trading bets the flow turns. You fade a sharp run-up by selling and a sharp sell-off by buying, entering against an overbought or oversold extreme.
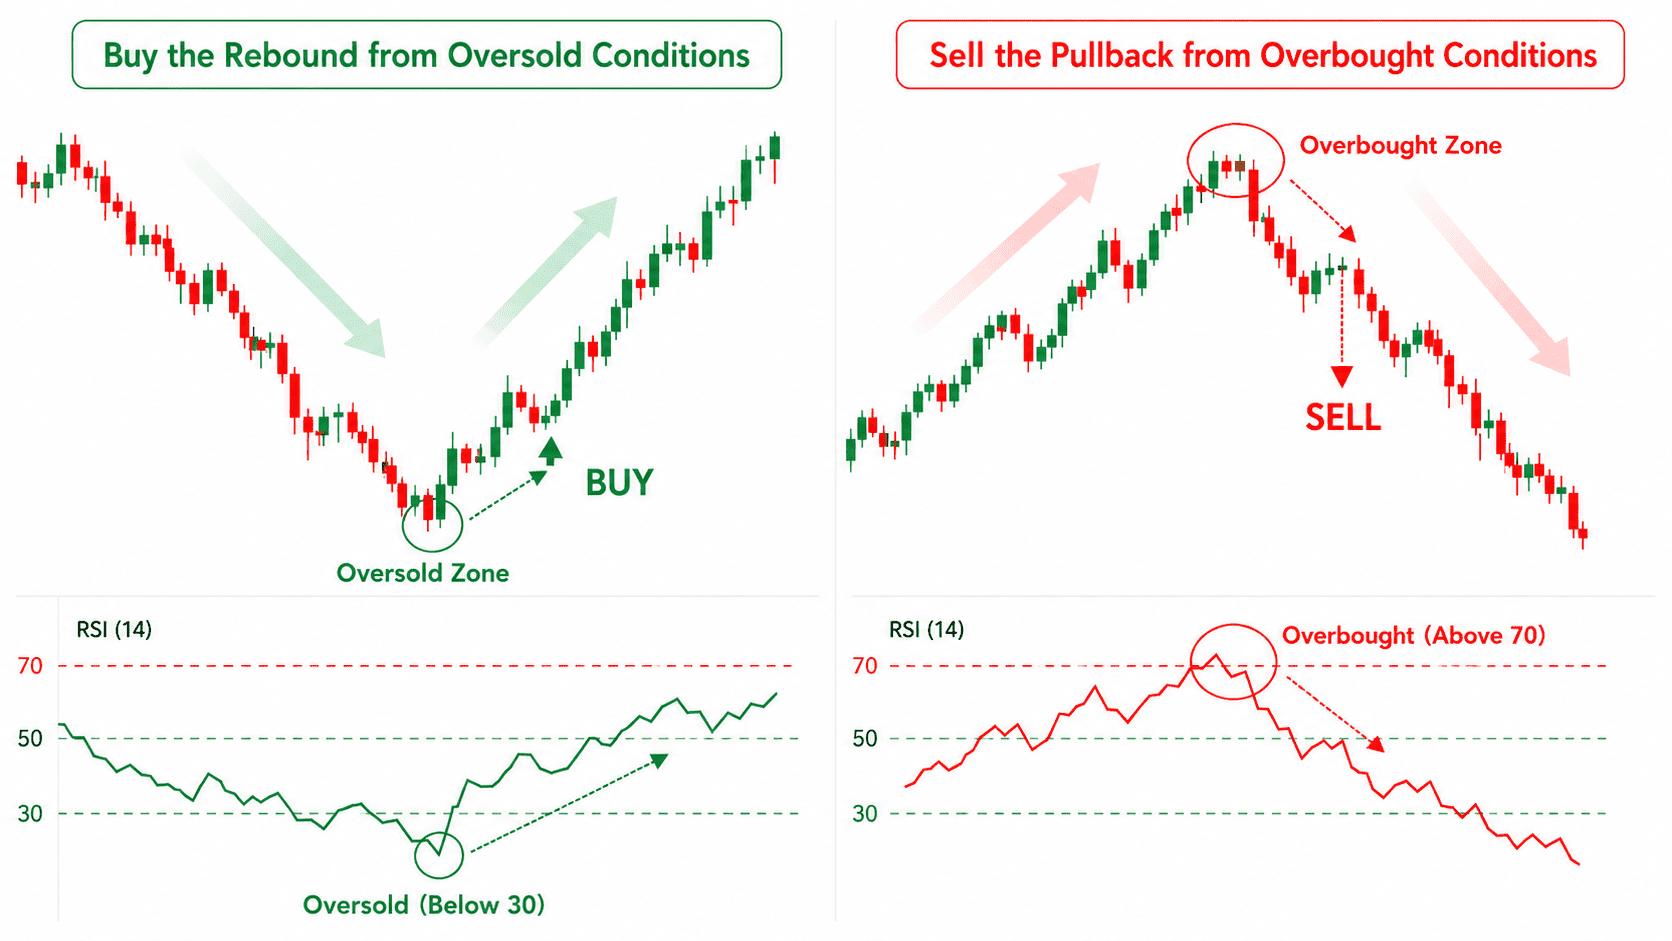
Because it cuts against the trend, a move that keeps running instead of reversing can pile up losses fast — which is why a clear stop is treated as especially important here. It's often paired with a gauge of overbought and oversold conditions, such as RSI.
Sample strategy-rule entry:
Names that have sold off hard over a short window and reached an oversold marker. Buy once a sign of a bounce shows. Stop out immediately if the recent low gives way.
Where "too far" actually is differs by name and market, so this is a style you confirm with your own testing rather than a fixed threshold.
▶ Go deeper into this style: Mean Reversion Strategy|Fade Extremes and Backtest It
6. Range Trading
What it keys on: When price is shuttling between a clear ceiling and floor — a range — you sell at the ceiling and buy at the floor, working the round trip. It's built for a directionless market where no trend is in play.
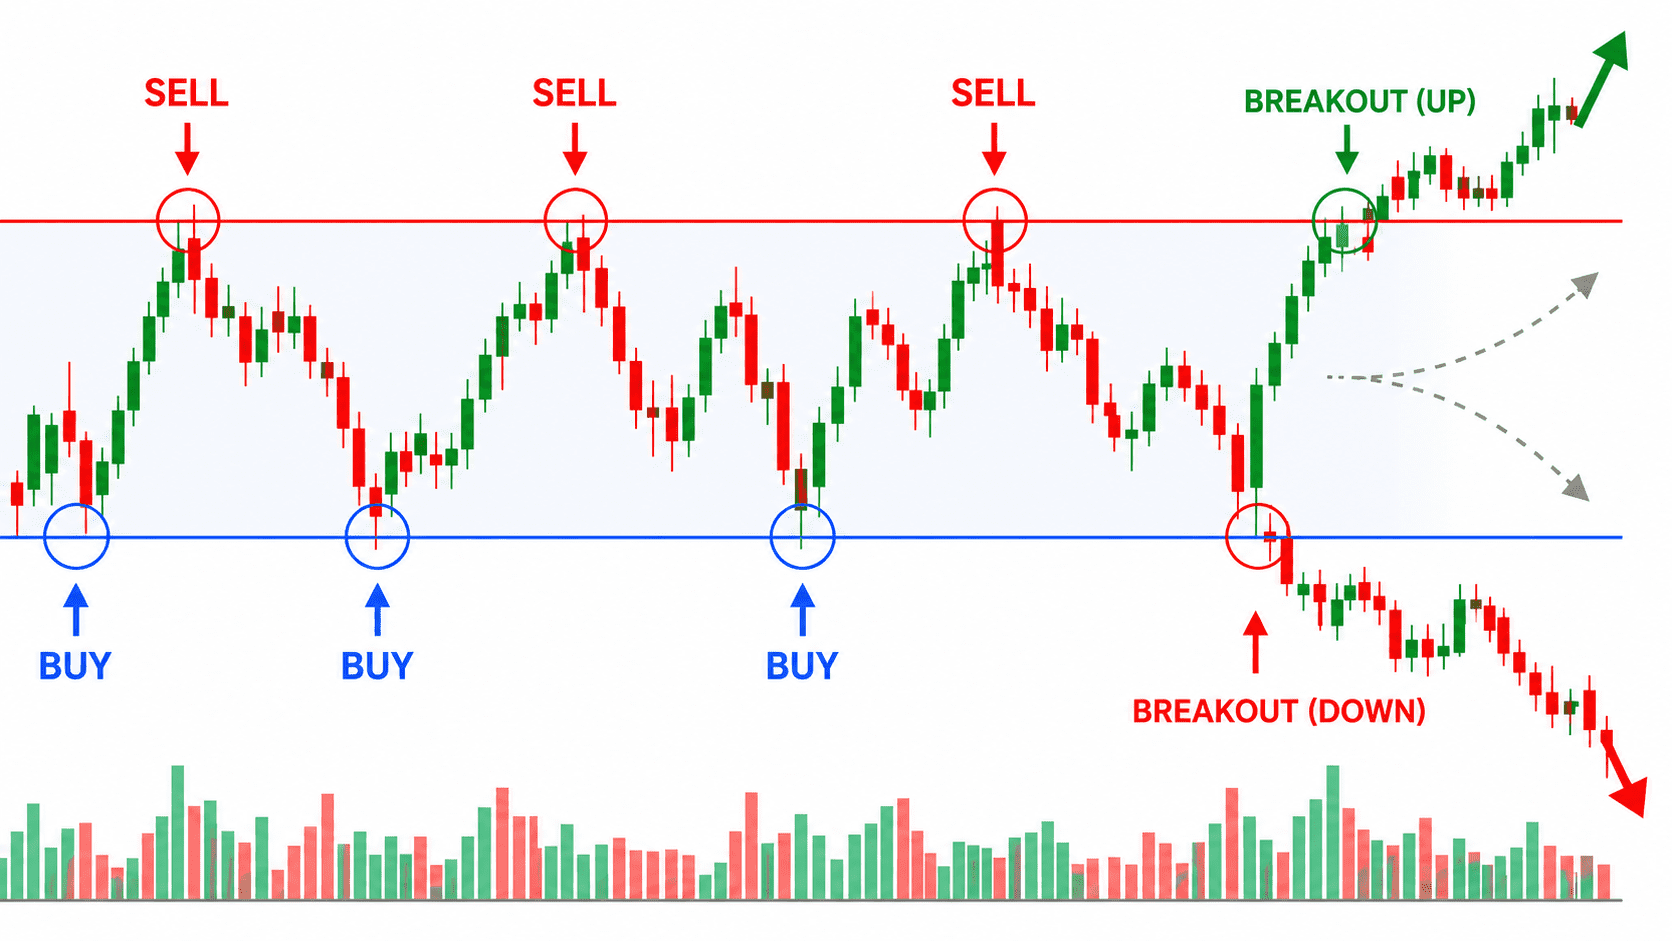
The key points are how you draw the range's ceiling and floor, and how you bail when price breaks out of it. Range trading and breakout trading are two sides of the same coin — you switch between them depending on whether you read the range as holding or breaking.
Sample strategy-rule entry:
Only ranges with a clear ceiling and floor confirmed multiple times. Buy near the floor, take profit near the ceiling. Bail if price closes below the floor.
Drawing the lines and knowing when the box breaks both improve with repetition on past charts.
▶ Go deeper into this style: Range Trading Strategy|How to Trade and Backtest a Range
7. Support / Resistance
What it keys on: Watching how price reacts at levels where it has bounced or stalled before — support below, resistance above. The idea rests on the fact that at horizontal price zones many traders are watching, price tends to bounce or stall when it returns.
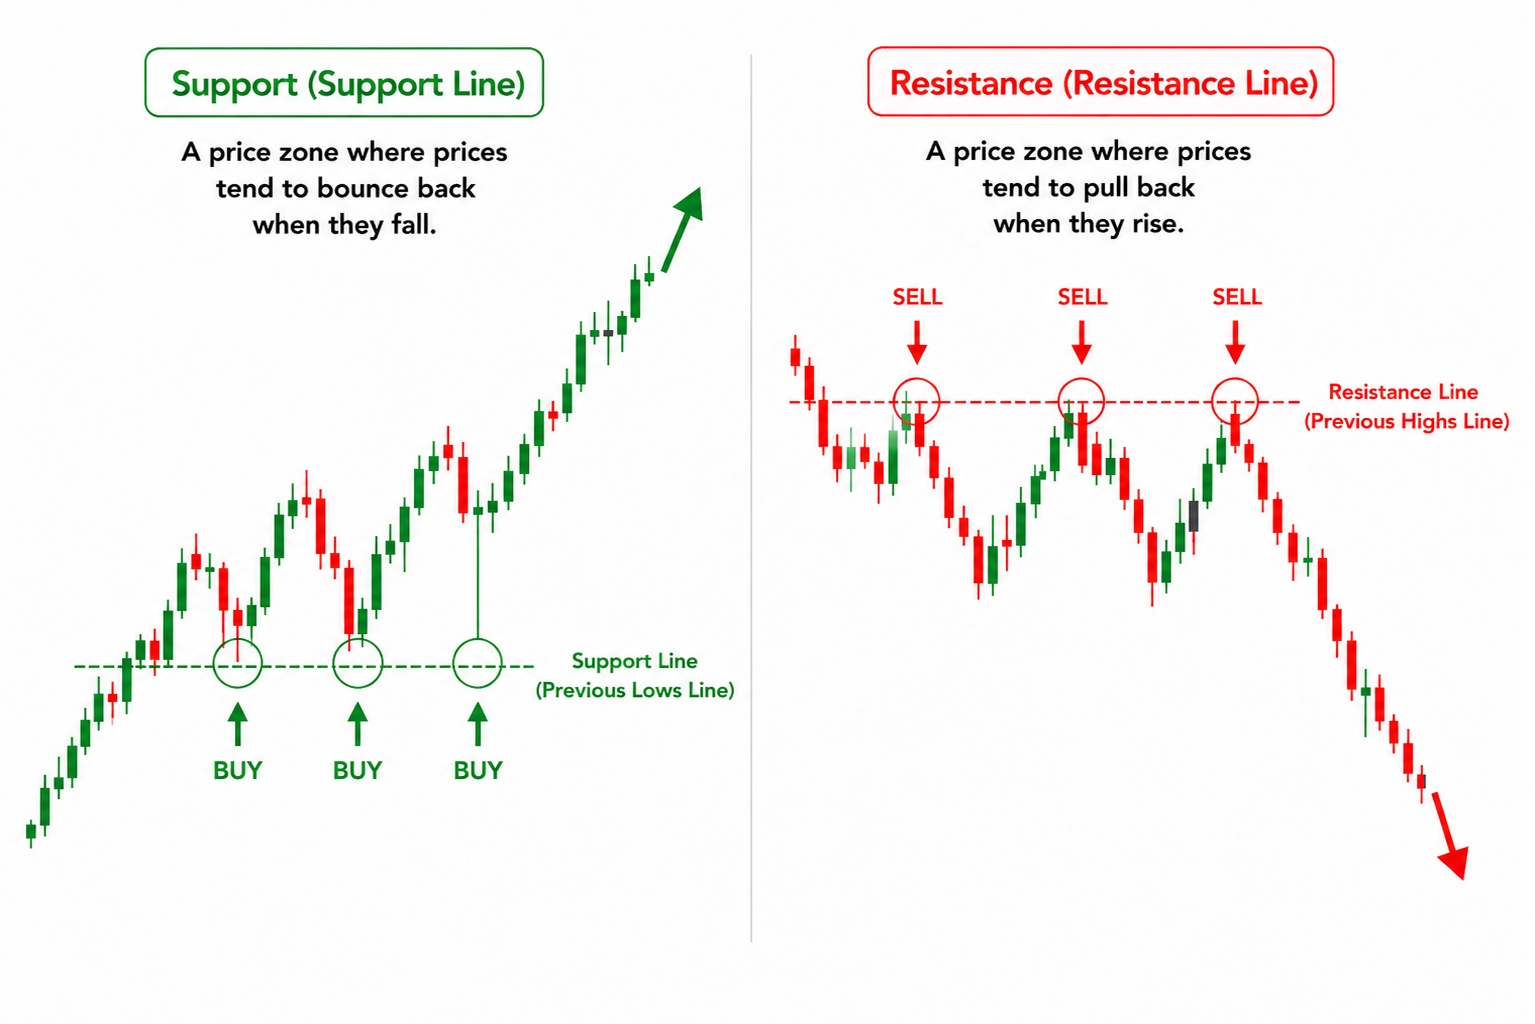
You can buy a bounce off support and sell a rejection at resistance, or treat a clean break of either as a breakout. The fork is which zones you count as valid lines — how many times price reacted there, how recent the low or high is.
Sample strategy-rule entry:
When price approaches a zone that has bounced at least twice before, buy once the bounce is confirmed. Stop out if price closes through that zone.
Which levels are worth trusting is a read you calibrate by testing, not by eyeballing one chart.
▶ Go deeper into this style: Support and Resistance Explained|Draw Levels and Backtest
8. Chart Patterns
What it keys on: Using a specific shape the candles draw as your signal. Double tops and double bottoms, triangles, head and shoulders — you spot a shape said to recur and enter in the direction it points to.
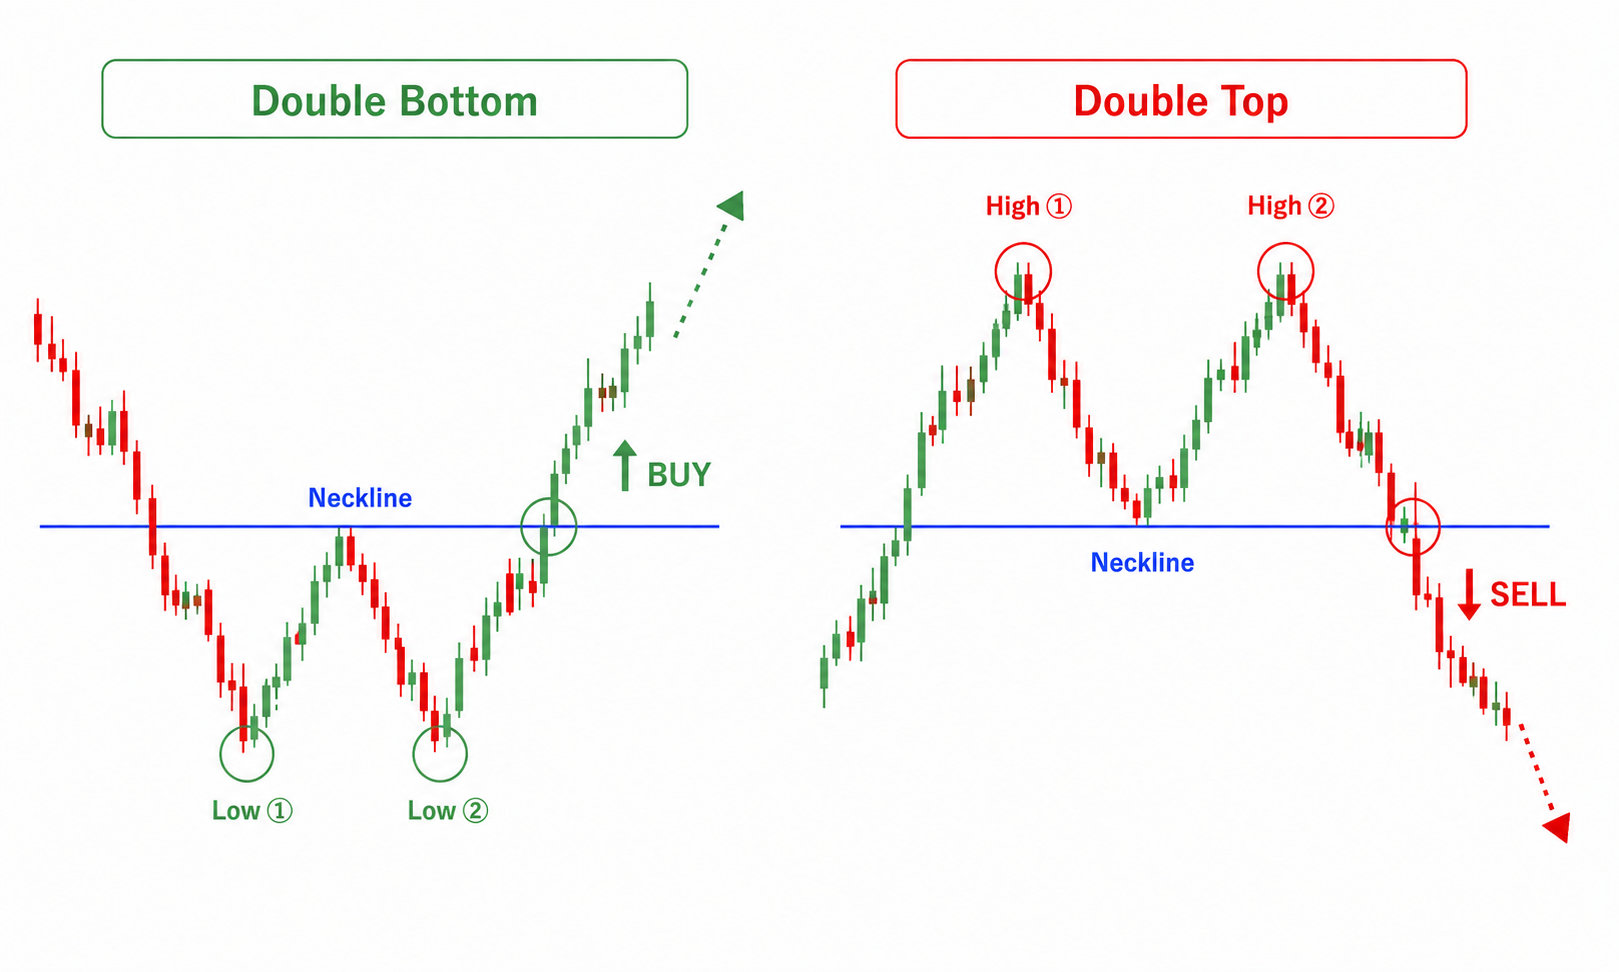
The key is how you define a pattern as "complete" (neckline broken, and so on). Shapes are easy to see subjectively, so this is a style where it's especially worth testing how consistently you actually recognize a given pattern on past charts.
Sample strategy-rule entry:
When a double bottom forms and price closes above the neckline, buy. Stop out if the recent low gives way. Skip it if the shape falls apart.
How consistently you read a pattern is something only repeated testing reveals.
▶ Go deeper into this style: Chart Patterns Explained|Read the Shapes and Backtest Them
Strategies are to be tested, not memorized
We've walked through eight styles — now back to where we started. There's no ranking among them, and which one fits you can't be known until you try.
Reading "this strategy wins" in a book or online doesn't mean it fits your temperament, your daily rhythm, or the names you watch. The patient, long-horizon dip-buy may not suit someone impatient; the fast short-term fade may be hard for someone who can't sit at the screen. The fit between a style and you only shows once you put your hands on it.
That's where backtesting earns its keep. Take a style that caught your eye, drop it onto past charts with Chart Replay, and test "how do I call this, in this style" over and over without real losses. Then log the results with strategy tags and review them with AI analysis. Run that loop, and "which style do I actually click with" stops being a gut feeling and shows up as data.
The concrete how-to for testing each style is covered in the dedicated articles linked above. Use this article as your map, and start with whichever style caught your eye — one at a time.
FAQ
Q. Which strategy should a beginner start with? A. There's no single answer. Because fit varies from person to person, skim the eight styles here, and start backtesting the one where you feel "I could make this call." Trying it is what reveals whether it suits you.
Q. Can I combine multiple strategies? A. Yes. In practice, combining styles — buying the dip off a moving average, for instance — is the norm. Understand each on its own first, then find your own blend through testing.
Q. How do I make a strategy my own? A. Test it repeatedly on past charts, log the results, and review them. Run a style you're drawn to through Chart Replay again and again, log it with strategy tags, and you build up the evidence for whether it fits you.
Q. What should I write in the strategy-rule field? A. Pin down "what conditions I enter on and where I exit" in a single sentence. Each style here comes with a sample entry, so you can start by rewriting it in your own words.
Q. Are there strategies not listed here? A. Of course. Trading strategies are endless, and this article organizes the core styles. Grab the big picture from these eight first, then dig into the ones that fit you as you get comfortable.
Wrap-up
We've organized eight core trading strategies: trend following, breakouts, buying the dip / selling the rally, moving averages, mean reversion, range, support/resistance, and chart patterns. They aren't mutually exclusive — they're meant to be combined.
What matters isn't finding the best strategy. It's finding the strategy that fits you. Take a style that caught your eye, test it on past charts, and confirm the fit with your own data. Backtest it. Review it. Improve it. Use this article as a map, and start with a single style.
ENTRIQ is a practice and review tool for individual traders, combining Chart Replay, trade journaling, and AI analysis in one place. Test a style that caught your eye on past charts, log it with strategy tags, and review it — all in one workflow.
ENTRIQ is not an investment advisory service. The strategies described here are a neutral rundown of commonly known styles and are not a guarantee of any strategy's effectiveness or profit. The information provided is for reference. All investment decisions are your own responsibility.
Reproduce this validation yourself
With ENTRIQ's chart replay, you can trade through past charts using the same rules.
Start 14-day free trialValidate your method on past charts
The same validation in this article can be reproduced with your own method. On past charts, do the classics really work?
- ✓ Replay past charts
- ✓ AI feedback on your trades
- ✓ Validate methods with statistics