How to Draw Trendlines and Backtest Your Trading Rules
How you draw a trendline changes your bias. This guide covers wick vs. body, touch count, and defining a valid break, then how to backtest it yourself.
In learn trend following through backtesting, we highlighted the trendline as one way to identify a trend. By connecting swing lows, or swing highs, you visually gauge the slope of the market. As a tool, it is remarkably simple.
But the difficulty becomes apparent the moment you actually plot one. Which lows you connect alters both the angle and the position of the line. The trendline you draw today can look different from the one you drew yesterday; your chart and another trader's chart will often show the line in different places. Plenty of traders struggle with this. The same chart produces different lines depending on the person, and even the same trader shifts the line every time they redraw it. And the signal that "the trend has shifted once price broke the line" varies in timing depending on how the line was drawn. The difficulty of trendlines comes down to this: behind the simple look sits a great deal of subjectivity.
This article lays out how to draw and use trendlines in a neutral way. Then, as the core of it, it shows how to write your own drawing rules into ENTRIQ's strategy rules field in two patterns — a discretionary version and a rule-based (numeric) version — and walks through how to check your drawing tendencies on past charts. This is not about "calling" price. It is about pinning down a way of drawing that otherwise drifts.
One thing up front: the approaches here are not "the correct answer." We line up the ideas that get used often, and take the position that which one fits your own instrument and timeframe is something you confirm through backtesting.
What a trendline is
A trendline connects successive swing lows (in an uptrend) or swing highs (in a downtrend) with a straight line, making the slope of the trend visible. In an uptrend you draw it as a line that supports rising lows from below; in a downtrend you draw it as a line that caps falling highs from above.
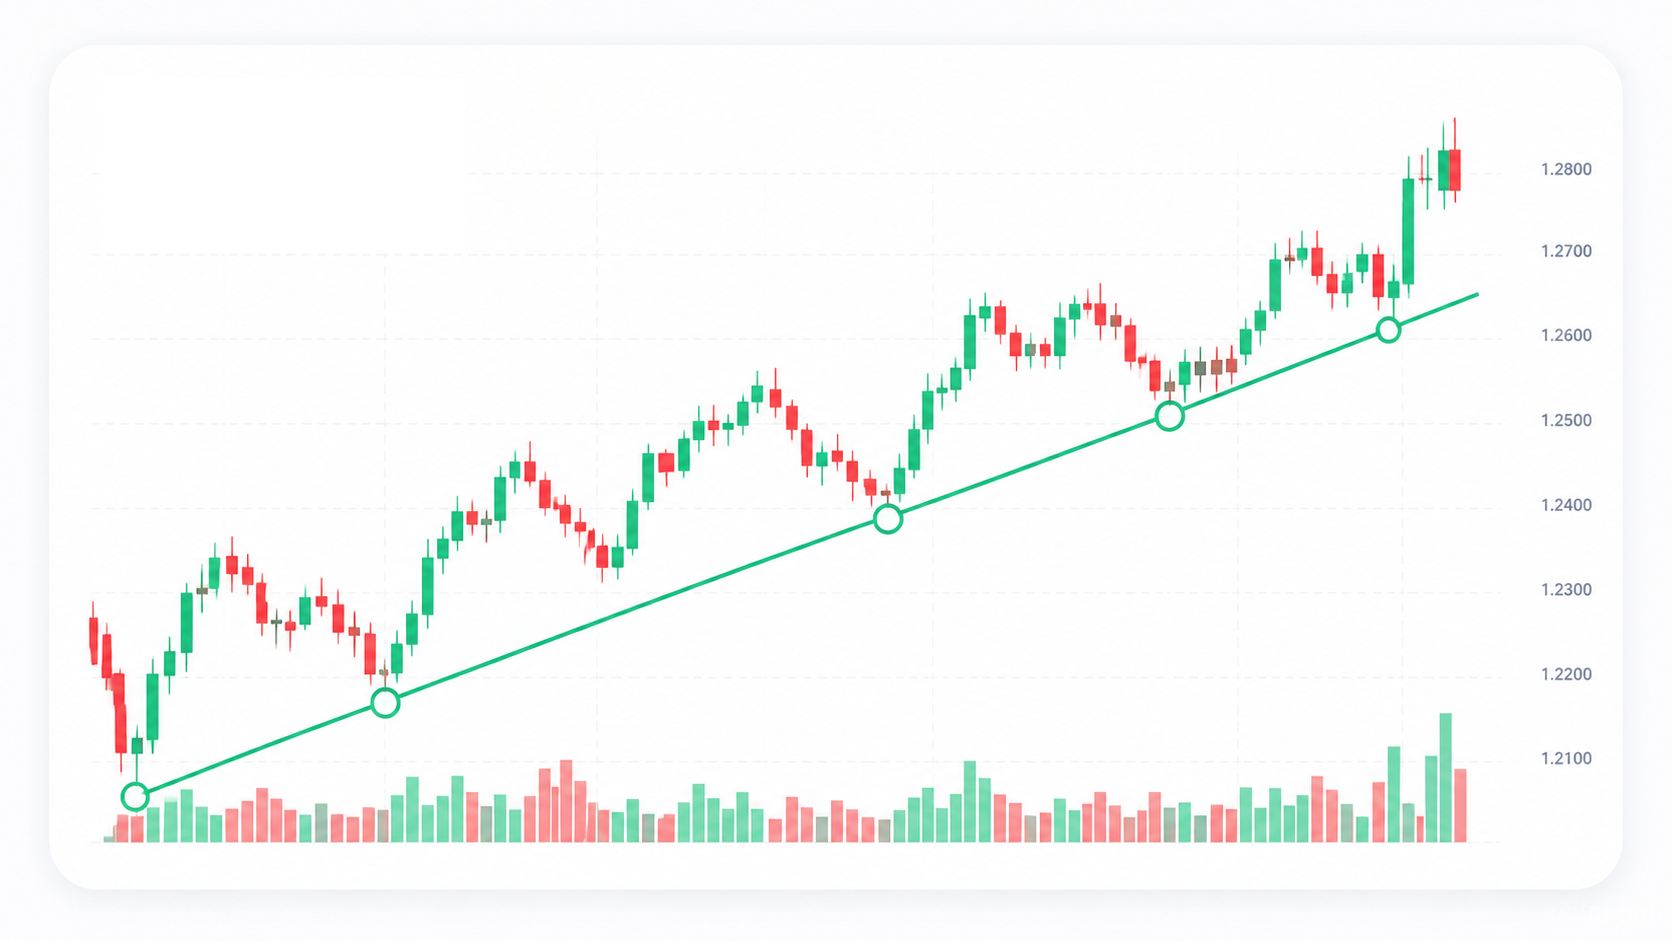
At the root of the idea is an observation: the market sometimes moves while holding a roughly constant angle. In an uptrend, even when price pulls back, it can find buyers again around a certain angled line and bounce — and while that keeps happening, you read the advance as continuing along the line. When price clearly breaks through that line, you read it as a sign that the slope which had been holding has given way, and that the momentum of the trend may have shifted. That said, a break alone does not confirm a reversal. Treat it as a sign that the slope may have broken, not as a settled conclusion.
Unlike a moving average, which is calculated automatically, a trendline is one you draw yourself — that's its defining feature. Because of that, it makes the "angle" of the market easy to keep in mind, and you can read the strength of a trend from whether the slope is steep or gentle. On the other hand, drawing it yourself means your subjectivity enters the drawing, and this is the first thing to face when you use trendlines.
Drawing a trendline is only half the battle. What matters is fixing your own drawing rules, and knowing — with lines drawn by those rules — where they hold and where they miss. If your drawing changes every time, your backtest results change every time too.
Why you confirm it with backtesting
There is no single correct way to draw a trendline. Some people connect the two most recent lows; others confirm the line is valid at a third touch before using it. Some draw from the tips of the wicks; others draw from the candle bodies. Which approach fits the instrument and timeframe you watch cannot be settled by arguing in words. It is an area you can only confirm by actually drawing, and doing it enough times.
And there is one more thing. Because the interpretation that "a break is a sign of change" depends on how the line is drawn, the same situation can split into "it already broke" and "it hasn't broken yet." To reduce that gap for yourself, you decide "this is how I draw," study many past charts with that rule, and internalize the patterns.
This is where chart replay (backtesting) helps. You rewind past charts and step forward one candle at a time, repeating "here is where I'd draw the line" and "this is where I call it a break" without being able to see the future. Because it uses virtual funds, there is no real loss risk, and you can pick out only the moments where a trendline holds or breaks and try them again and again. You can also compare a "draw from wicks" rule and a "draw from bodies" rule on the same past data.
How to draw a trendline: common approaches
How to draw a trendline differs from person to person. Rather than declaring one approach correct, here are the points people commonly focus on, laid out neutrally. Which one you adopt is for you to confirm as your own data through backtesting.
| Focus | The idea | Watch out for |
|---|---|---|
| How many points | Draw provisionally with 2 points, confirm the line is valid at a 3rd touch | With only 2 points, you may have drawn a line through points that lined up by chance |
| Wick or body | Draw from the tips of the highs/lows (wicks), or from the candle bodies | If you don't decide, two lines can be drawn in the same spot |
| Angle of the line | Read the trend's momentum from whether the slope is steep or gentle | A very steep line rarely lasts and tends to break early |
| Number of touches | The more a line has bounced, the more participants are seen as watching it | More touches doesn't mean it will hold next time |
Let's look at each focus a little more concretely.
How many points to connect
A trendline can be drawn with a minimum of two lows (or highs). But a line drawn from only two points may be a case of those two points lining up by chance, and a common view treats that as weak grounds. So a frequently used approach takes a step: draw a provisional line from two points, and only adopt it as a valid line when price touches that line at a third point and bounces.
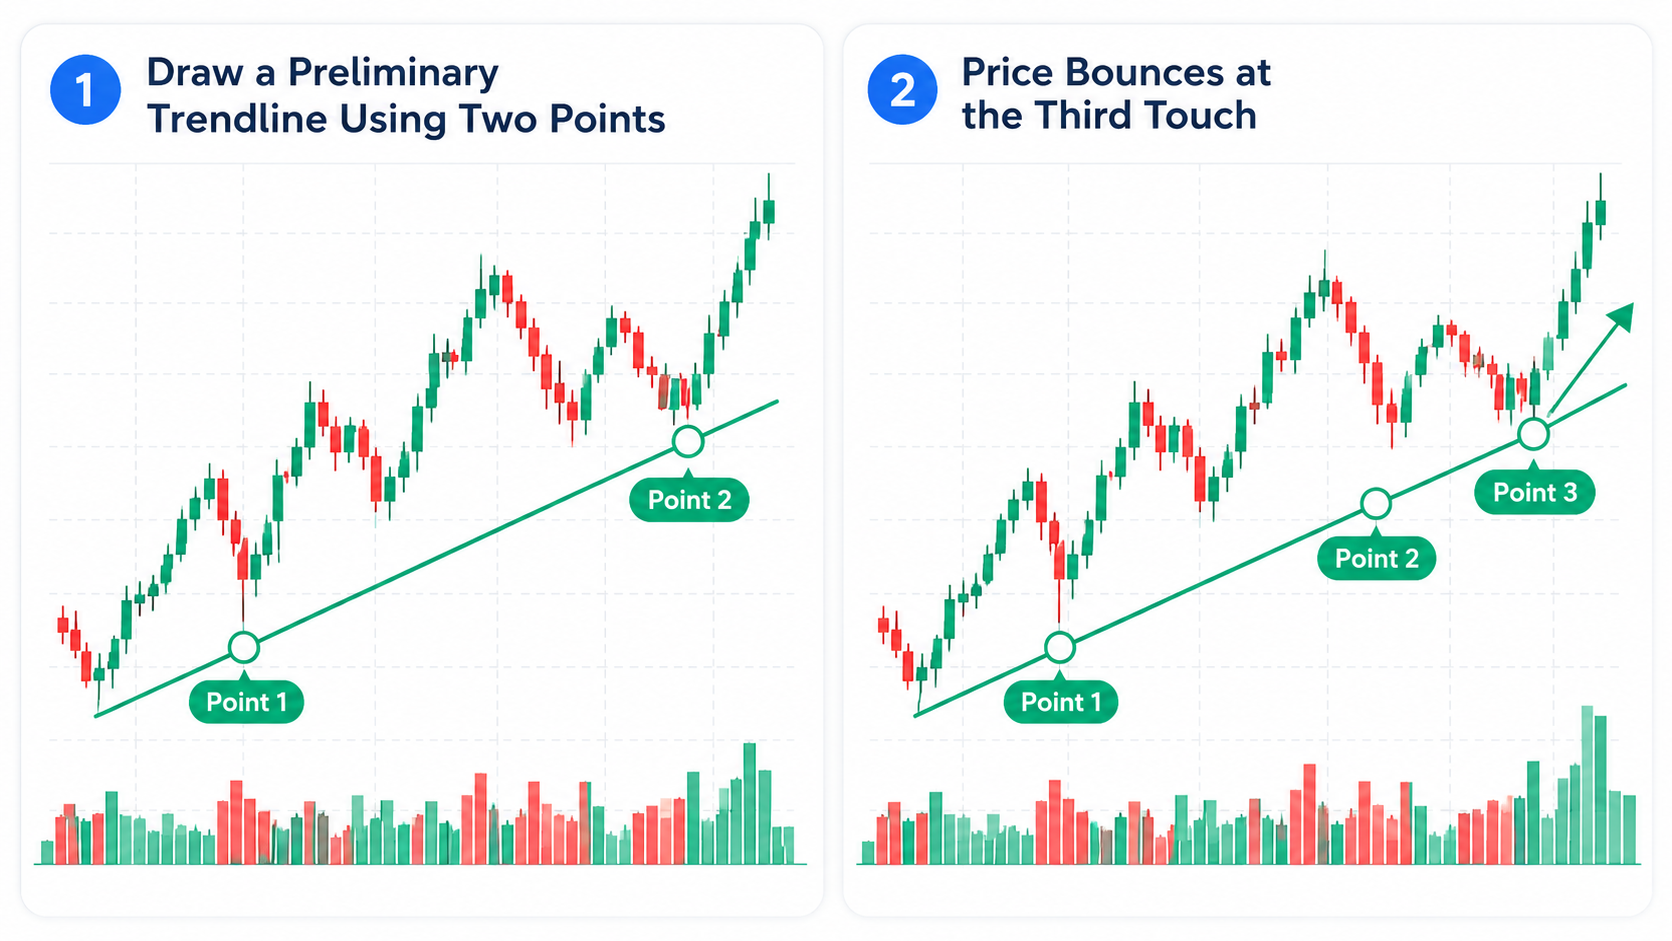
The catch is that waiting for a third point delays confirmation of the line. While you wait for that third touch, price can move, and by the time you've confirmed the line is holding you may have already missed the entry. Whether "provisional at 2, confirmed at 3" fits your own instrument and timeframe is worth confirming through backtesting.
Wick or body
This is the question of "where" on the highs and lows you draw from. There is the method of drawing from the tips of the wicks (the extreme high or low) and the method of drawing from the edge of the bodies (the open-to-close range). Drawing from wicks captures the extreme of the momentary move, but the line is more easily pulled steeper or flatter by a wick that spiked temporarily. Drawing from bodies lets you ignore momentary wicks, so the line is steadier, but you can miss a bounce that happened out at the wick.
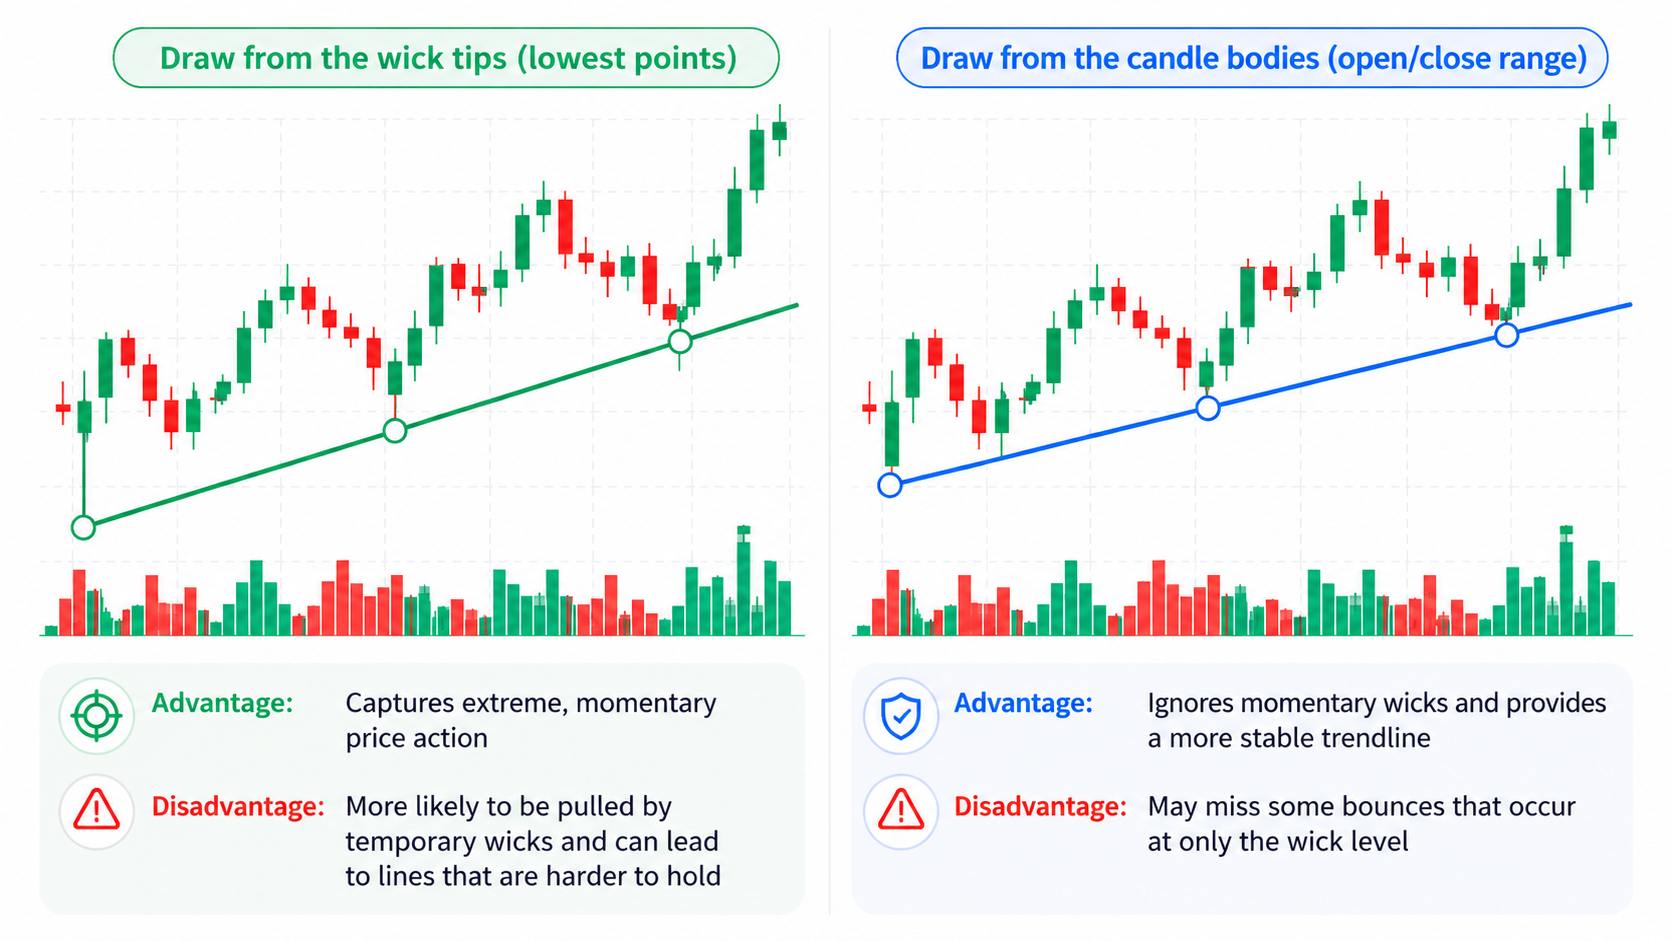
The catch is that if you draw without deciding this, you end up with two lines in the same spot — a wick-based line and a body-based line — and your read on "which one broke" wavers. Neither is superior; fixing which one you draw from ahead of time is what makes your decisions repeatable. This too is something to settle by comparing "with wicks it looks like this, with bodies it looks like that" in backtesting.
The angle of the line
This is the idea of reading a trend's momentum from whether the trendline's slope is steep or gentle. A steep line shows price rising (or falling) at a fast pace; a gentle line shows a trend moving slowly and steadily. There is no good or bad in the angle itself, but it is material for gauging how strong the momentum is.
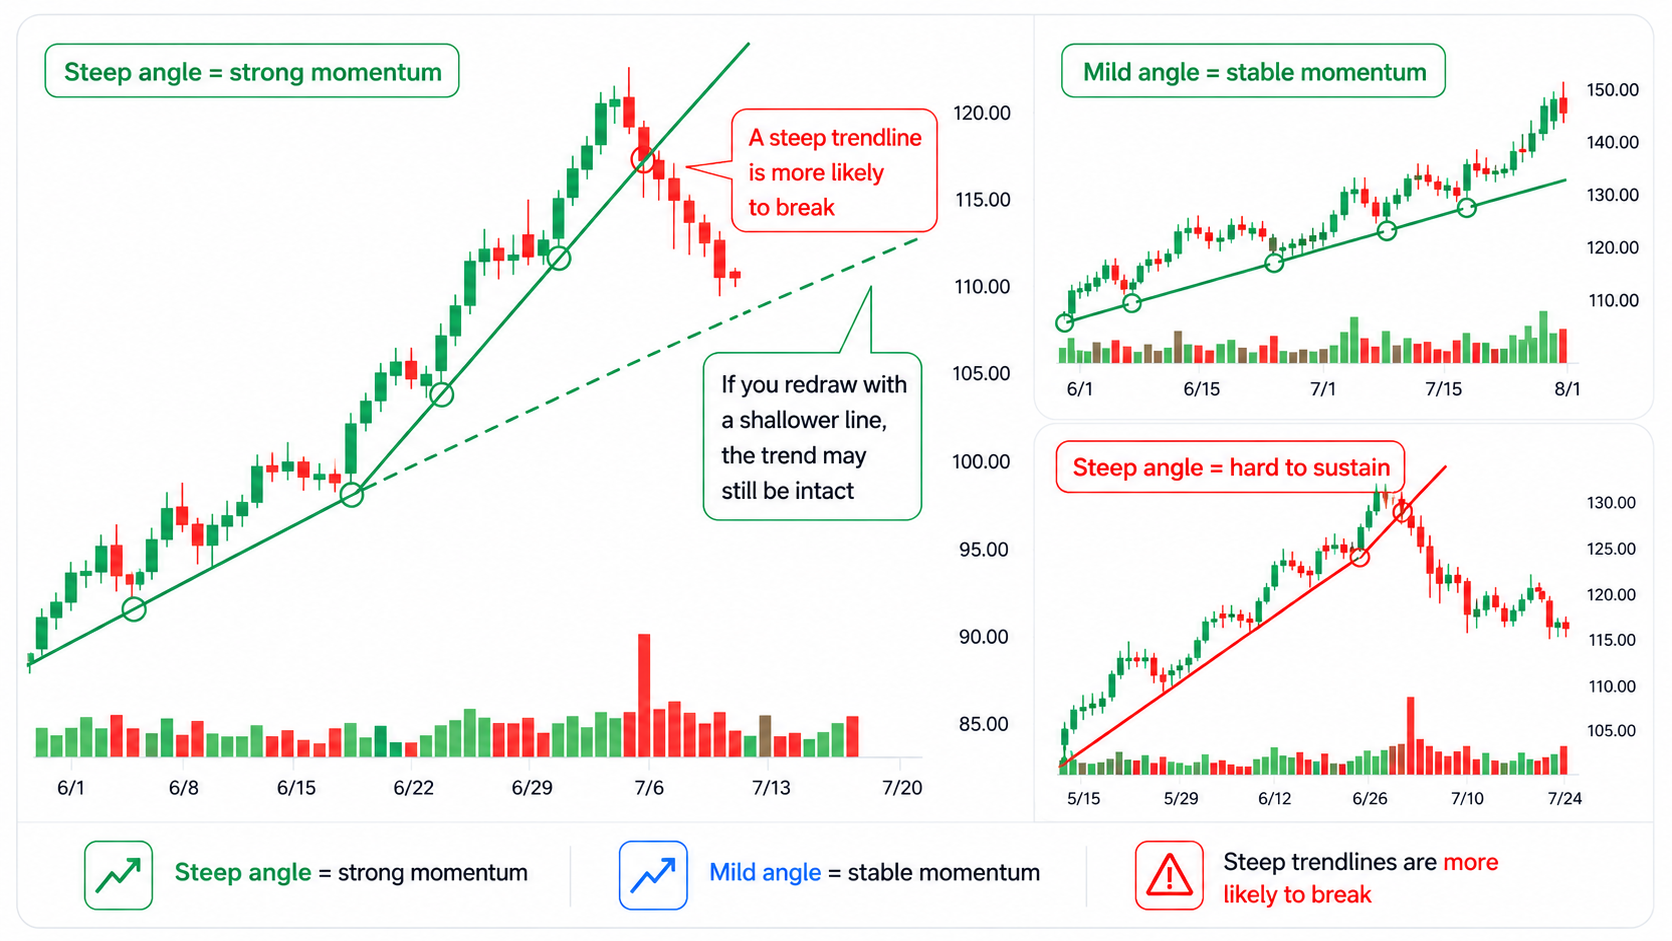
The catch is that a very steep line rarely lasts. A market that surged in a short span cannot hold that angle and stalls somewhere, and the steep line breaks easily. A steep line breaking does not necessarily mean the whole trend is over — redraw it at a gentler angle, and it can look like the trend is still intact. How to use lines at different angles is another part to work out in testing.
Number of touches
This is the idea that the more a line has bounced, the more participants are watching it. A line with many touches is where a lot of people are watching for "a bounce here," so it is judged more likely to react when price approaches again. Conversely, a line that has only been touched once or twice draws thin attention and is seen as weaker grounds.
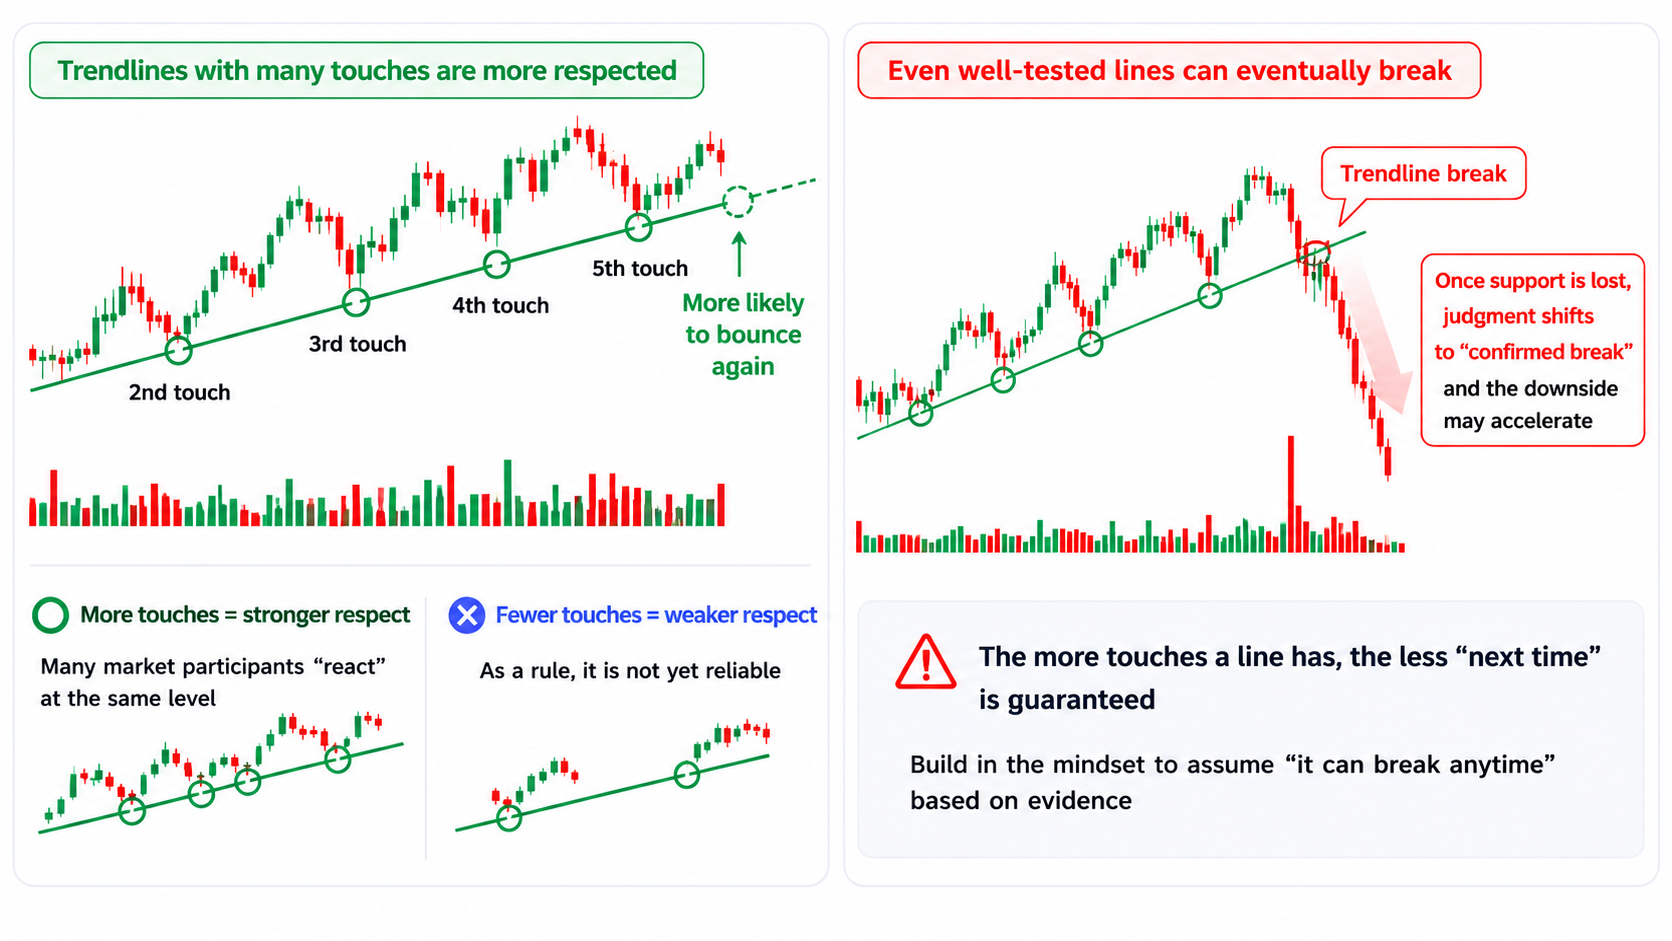
The catch is that more touches does not guarantee it holds again next time. If anything, a line tested many times may eventually break. There is also this side to it: the more a line is watched, the more that a break can chain into closing orders from participants who read it as "the support is gone," so the move in the break's direction tends to be larger. Use touch count as material for gauging a line's reliability, while deciding your response after a break on the premise that "it may break at some point."
Here is the important part: these focus points are not mutually exclusive. It is common to combine them — for example, "draw from the bodies, and confirm at a third touch." The more you combine, the stronger the grounds for the line, but the longer it takes to confirm and the fewer entry chances you get. Where you place yourself on this trade-off is also something to look at through backtesting.
Rule your entry and exit together
The easiest thing to trip on when using trendlines is deciding only "how to draw the line" and using it without deciding "how to get in and how to get out." Even if you can draw the line, when where you enter and where you exit stay vague, your backtest results scatter and can't be evaluated. Always define entry and exit as a set.
There are two broad ideas for entering with a trendline. One is to aim for a bounce off the line — price falls to the uptrend line, gets supported there, and you buy after confirming it bounced. You can get in at a favorable price, but you have to judge whether that bounce is real. The other is to use a break of the line as the trigger — price breaks above a downtrend line, meaning the downward slope has given way, and you treat that as a sign the trend may be shifting. Because breaking above alone does not confirm a reversal, though, it is common to add a condition such as confirming on the close or on the next candle.
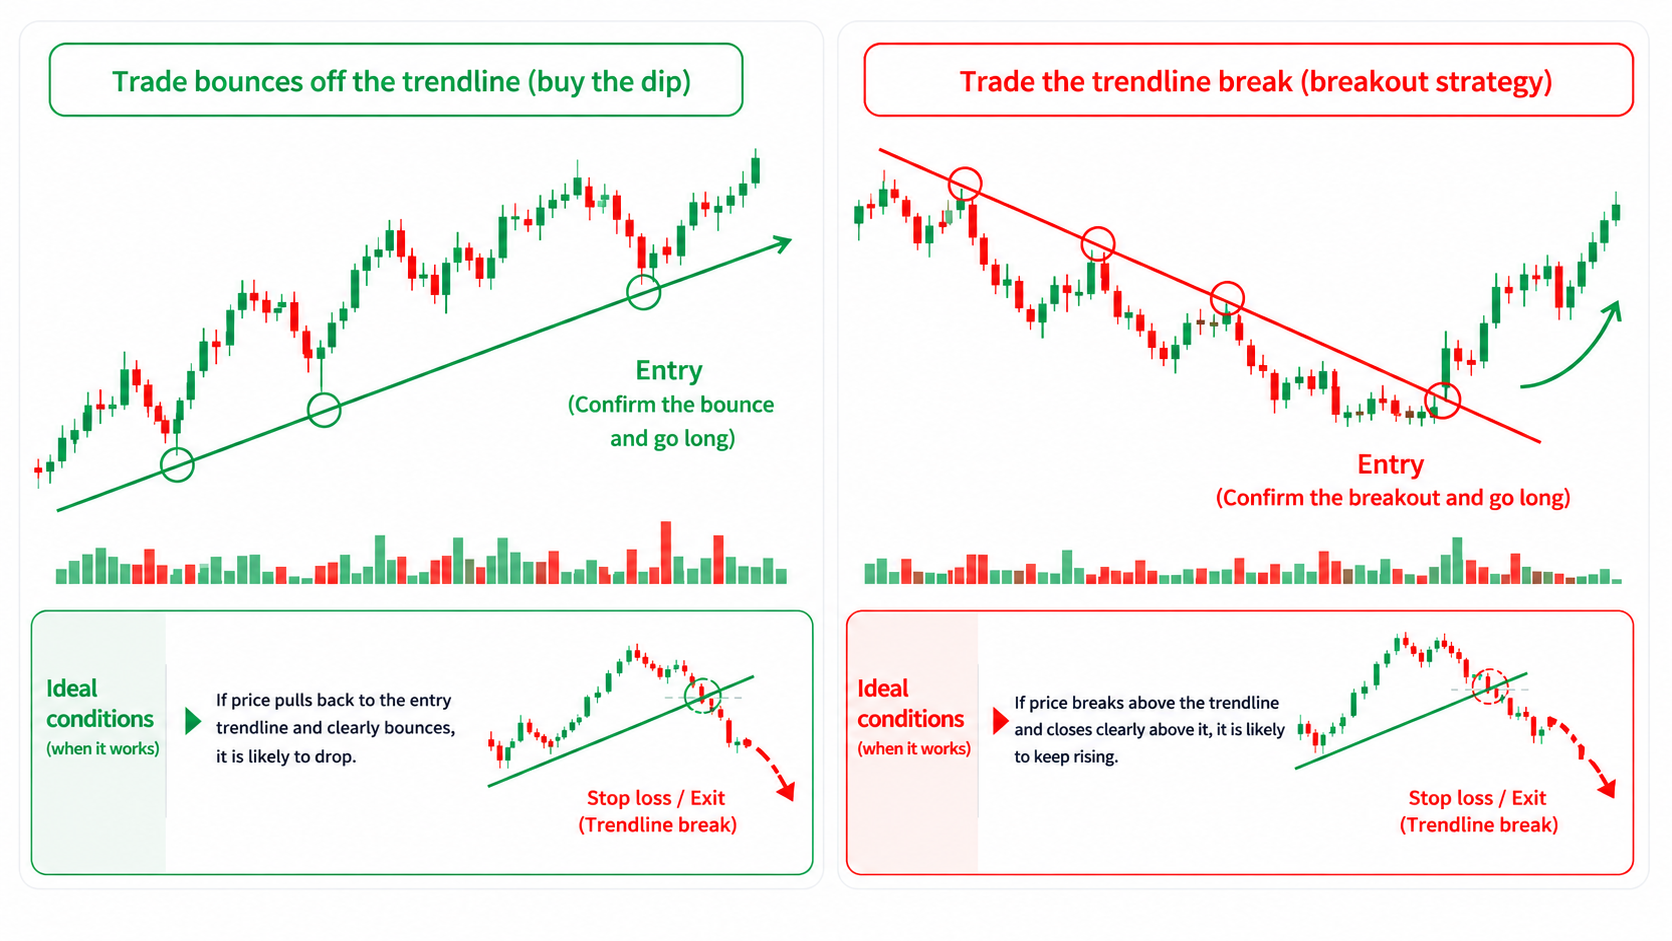
For the exit (the condition to get out), there is an idea that pairs well with trendlines. When price clearly breaks through the line you used as your reason for entering, you treat it as "the line stopped holding as support = the premise you entered on has given way" and step out. Tying your stop loss to the line keeps the exit decision from swaying with emotion. When the reason to be in (the line is holding) breaks, get out — deciding this correspondence first is the core of building rules with trendlines.
How you define "clearly broke through" is also for you to decide, just like the drawing. Stepping out every time a wick dips through for a moment leaves you tossed around by fakeouts. For the break criterion, you have options such as:
- Step out when it breaks on the close (ignore a temporary wick break)
- Step out when it closes a set percentage below the line (e.g., −1%)
- Step out when price does not recover on the candle after the break
Which one you adopt changes the "not broken yet" versus "already broke" judgment. Like the drawing, this is a part to settle through backtesting on your own timeframe and instrument.
Two ways to fill in the strategy rules field
ENTRIQ's strategy tag has a strategy rules field to write down your criteria. Writing your trendline drawing and usage here lets you look back, each time you backtest, at whether you drew and judged as your rules say. There are two broad ways to write it. Neither is superior; pick whichever makes your decisions easier to reproduce. The discretionary version defines the situation in words; the rule-based version fixes the conditions in numbers.
Pattern A: Discretionary (define the situation in words)
A discretionary style. You define context, entry, stop, exit, and no-trade conditions in words rather than binding them with numbers — organizing the elements you always check when you judge.
Context: An uptrend with rising highs and lows. Require that a line can be drawn connecting three or more recent lows on a body basis. Entry: Buy when price falls to the uptrend line, bounces, and the candle confirms as an up candle. Don't chase from a spot far from the line. Stop: When price clearly closes below the trendline used as the reason, judge the support has given way and step out. Take profit / exit: Consider taking profit at a higher high or a key level. Hold as long as the advance along the trendline stays intact. No-trade conditions: Don't enter when the line's angle is too steep, or when the grounds for the line (touches) are only two points.
Pattern B: Rule-based / numeric (spell out conditions in numbers)
A rule-based style. You fix the decisions in numbers so anyone reading arrives at the same conclusion. Because trendlines carry subjectivity in the drawing, you cover the part you can't fully reduce to numbers by spelling out the drawing conditions, like "body basis" and "three lows."
Target: An instrument where an uptrend line can be drawn connecting the three most recent lows on a body basis. Entry condition: Price touches the trendline and bounces, and the next candle's close confirms above the prior candle's high. Stop: Step out when the close is below the trendline (or −2%). Take profit: Take half off when a recent high is broken; hold the rest until a trendline break. Filter: Exclude cases where the price gain over the last 20 bars is extreme (right after a sharp spike).
Putting it in numbers makes the review quantitative and easier to aggregate in backtesting. That said, the numbers and conditions here — three points, −2%, the last 20 bars — are only "samples of how to write it," and do not guarantee effectiveness or profit. Backtest on your own instrument and timeframe, and adjust while looking at the data.
The backtest-and-record loop
Once you've defined your rules, pick moments on past charts where a trendline can be drawn, and repeat virtual entries and exits without being able to see the future. For each trade, record points like these in your trade records and strategy tags:
- Whether you drew the line by the rules (wick or body basis, at which point you adopted it)
- At which point you called a bounce or a break
- Whether entry and exit followed the rules
One tag per trade. Tag it something like "Trendline – bounce play," and you can later pull together only the trades on that rule to check win rate, P/L, average risk-reward ratio, and so on.
One thing to watch: while the sample size is small, don't take the numbers at face value. Deciding a drawing method is good or bad on 5 or 10 results is too early. Build up your number of attempts with risk-free backtesting first, then look at the tendencies.
The chart above is a sample showing how records "look" when you test different drawing methods (not real data). With the same trendline, changing the drawing rule changes the data — confirming that difference with your own hand is the point of backtesting.
You can also review the records you build up with AI Analysis. AI Analysis is not trade signals or recommendations; it is a feature that puts observed tendencies from your past trade data and notes into words. It gives you material for catching patterns you'd miss on your own — like "the trades where I stopped out on a line break often say 'the angle was steep' in the notes."
Four common mistakes
- Redrawing the line to suit yourself. When a trade moves against you, it's tempting to redraw the line at an angle that justifies your position. Fix your drawing rules first and don't move them afterward — that's the premise of backtesting.
- Mixing wicks and bodies. Drawing from wicks sometimes and bodies other times makes the "where did it break" judgment waver every time. Pick one and stick with it.
- Trusting a line from only two points. Putting your grounds on a line drawn through two points that lined up by chance can lead to quick breaks and a string of stops. If you make it a rule to confirm at a third touch, decide that and test it.
- Not deciding your response after a break. Any trendline may break at some point. If you haven't decided in advance whether to step out on a break or redraw and wait, your judgment freezes the moment it breaks.
FAQ
Q. Are trendlines hard for beginners? A. The idea of "connecting lows to lows" is easy enough to grasp. The hard parts are the subjectivity in the drawing and where you call a break. As in this article, decide your drawing rules (body basis, three points, etc.) and your definition of a break first, and put in enough repetitions of backtesting — even a beginner can build them into their own rules.
Q. Which is correct, wicks or bodies? A. There's no rule that one is correct. Wick basis captures the momentary extreme; body basis keeps the line steady. What matters is fixing which one you draw from and not redrawing it. The sure way is to draw both on the same past data and pick the one where your reads waver less.
Q. How is a trendline different from a moving average? A. Both are tools for reading a trend's direction, but unlike a moving average, which is calculated automatically, a trendline is one you draw manually. That makes a trendline easier for keeping the "angle (momentum)" in mind, while carrying subjectivity in the drawing. We cover moving averages in one piece at how to use moving averages. Many people use them together.
Q. Should I stop out as soon as a line breaks? A. It depends on how you define "broke." Stopping out just because a wick dipped through for a moment leaves you tossed around by fakeouts. Decide a break criterion for yourself — broke on the close, broke by a set percentage — and following that criterion keeps your decisions consistent. Confirm the criterion itself through backtesting.
Q. Which instruments can I practice trendlines on? A. ENTRIQ's backtesting supports US stocks, FX, commodities, and crypto. Japanese stocks are planned for a future release. You can also view multiple timeframes at once, so it works for practice that keeps a higher-timeframe trendline in mind.
A trendline is simple to state — "connect lows to lows" — but precisely because how you draw it changes your read, fixing your own drawing is the starting point. Write your drawing rules and your definition of a break into the strategy rules field as a set, and confirm them over and over on past charts where you can't see the future.
ENTRIQ is a stock practice and backtesting tool for individual traders, integrating chart replay, trade records, and AI Analysis.
This article does not guarantee the effectiveness or profit of any specific method or rule. The numbers and examples given are samples to illustrate how to write, and do not indicate investment results. Make your investment decisions at your own responsibility.
Reproduce this validation yourself
With ENTRIQ's chart replay, you can trade through past charts using the same rules.
Start 14-day free trialValidate your method on past charts
The same validation in this article can be reproduced with your own method. On past charts, do the classics really work?
- ✓ Replay past charts
- ✓ AI feedback on your trades
- ✓ Validate methods with statistics