Dow Theory Explained: Reading Higher Highs and Higher Lows
Dow Theory reads trend from price structure — higher highs and higher lows. This guide covers swing points, spotting reversals, and backtesting your own trend-reading rules.
In Trend Following Strategy: Build and Test Your Rules Through Backtesting, we listed "higher highs and higher lows" as one way to identify a trend. Reading trend directly from price structure, without indicators — that approach is rooted in Dow Theory.
Dow Theory sounds intimidating, but the part you actually use in trading is just watching how the highs and lows are moving, and the idea itself is plain. Still, the moment you try to apply it yourself, the difficult part begins. Which swing highs and swing lows actually matter? Do you define a high by the wick or the candle body? Does a brief one- or two-bar move count as a pullback, or only a drop with real range? And at what point do you decide a trend has ended? Without clear definitions, your read wavers even on the same chart.
This article focuses on Dow Theory in the form you can actually trade with. Then, as the core, it shows how to write your own trend-judgment rules into ENTRIQ's strategy rule field — in two patterns, a discretionary approach and a rules-based approach — and walks through how to confirm your judgment is consistent on past charts. This isn't about predicting the next move in price. It's about putting your own read of a trend into words and defining it clearly.
To be clear up front: the views below aren't presented as "the right answer." They're common ways of thinking, laid out neutrally, and whether your way of reading market structure fits your symbols and timeframe is something to confirm through backtesting.
What Dow Theory is
Dow Theory is a classic framework, originally built to explain the movement of the whole market, made up of six basic tenets. But the part you use day to day in personal trading is one idea — a trend stays in force until a clear reversal signal appears — and the price structure (higher highs and higher lows, or lower highs and lower lows) used to identify it. This article focuses on that practical side.
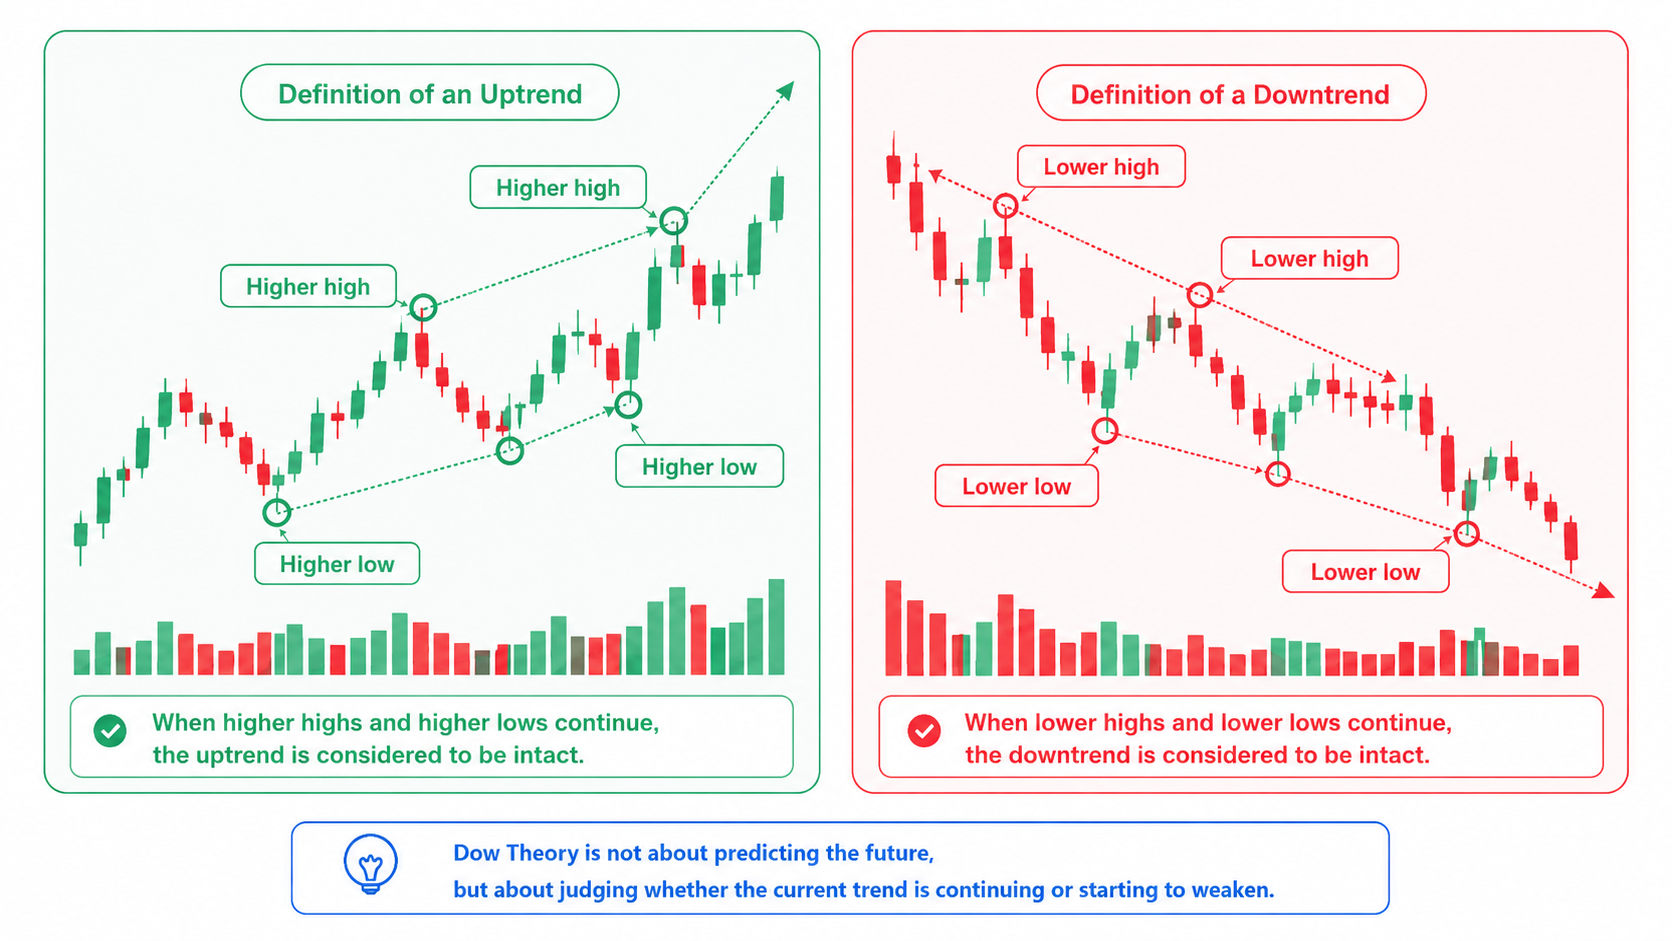
The thing to hold onto here is that Dow Theory isn't a tool for predicting the future. It's not for calling whether price goes up or down next; it's a way to determine whether the current trend is still running, or starting to break down. Keep that lens, and everything that follows gets much easier to read.
The idea is simple. An uptrend is defined as a state where the structure is making higher highs and higher lows; a downtrend, lower highs and lower lows. In an uptrend, price takes out the prior high, and the pullback after it stops at a level higher than the prior low — while both of these hold, you read the trend as continuing.
What sets Dow Theory apart is that it defines trend through price structure alone, without relying on indicators or trendlines. You read the shape of the chart itself, so there's nothing to calculate or draw, and it's easy to take in at a glance. Because so many trading methods assume "is there a trend or not" as a premise, Dow Theory is widely used as the underlying way to determine that.
What matters in Dow Theory is less the question "are the highs and lows rising" and more deciding, for yourself, which swing points actually matter. If that isn't settled, the same chart reads as a different trend from person to person — or from one day to the next, even for the same person.
Why confirm it through backtesting
The definition is clear enough, but applied to a real chart, spots where the call is hard always come up. Of all the small swings, which do you count as a swing high or low? Do you count every minor pullback, or only pullbacks with some range? This question of which swing points actually matter has no single right answer and won't be settled by arguing it in words.
And there's one more thing where the call splits most in Dow Theory: spotting the reversal. When price makes its first lower low inside an uptrend, do you read it as the trend ending, or as one deep pullback? Without a standard for this, you waver at every turn and end up "noticing only after it's over."
These are areas where there's no way around deciding "this is how I count," "this is how I spot it," then looking at enough past charts with that rule until the pattern becomes second nature. This is where chart replay (backtesting) comes in. You rewind a past chart and step it forward one candle at a time, judging "is this a higher low" and "do I call a reversal here" over and over with the future hidden. Since it runs on virtual funds, there's no real loss risk, and you can pick out only the spots where a trend continues or breaks down and run them again and again.
Reading the structure: common approaches
Here are the focuses for using Dow Theory in trading, laid out neutrally. None of them is "the right answer"; each is something to confirm against your symbols and timeframe through backtesting.
Note: below, a swing low means the low where price stopped dropping mid-uptrend and turned back up — the low that became the origin of the next move up. In a downtrend, the swing high is the high where price stopped rising and turned back down.
| Aspect | Core concept | Common pitfalls |
|---|---|---|
| Swing low / swing high | Identify continuation by whether the recent pullback low (swing low) is rising | Which low you count as the "swing low" involves subjective judgment |
| How you count swings | Ignore minor swings and count only swing points with some range | Count too finely and your read becomes inconsistent; too coarsely and reversals come late |
| Trend reversal | When the structure breaks and a lower low forms, read it as a reversal sign | Telling a deep pullback from a real reversal is hard |
| Higher timeframe | Line up the higher-timeframe trend with the timeframe you're trading | Trend direction can disagree across timeframes |
Let's look at each focus a little more concretely.
Swing low / swing high
The core of identifying an uptrend is the "swing low." What matters here is that a swing low isn't just "where price stopped dropping" — it's the low that became the origin of the move that went on to take out the prior high. Put the move in one line:
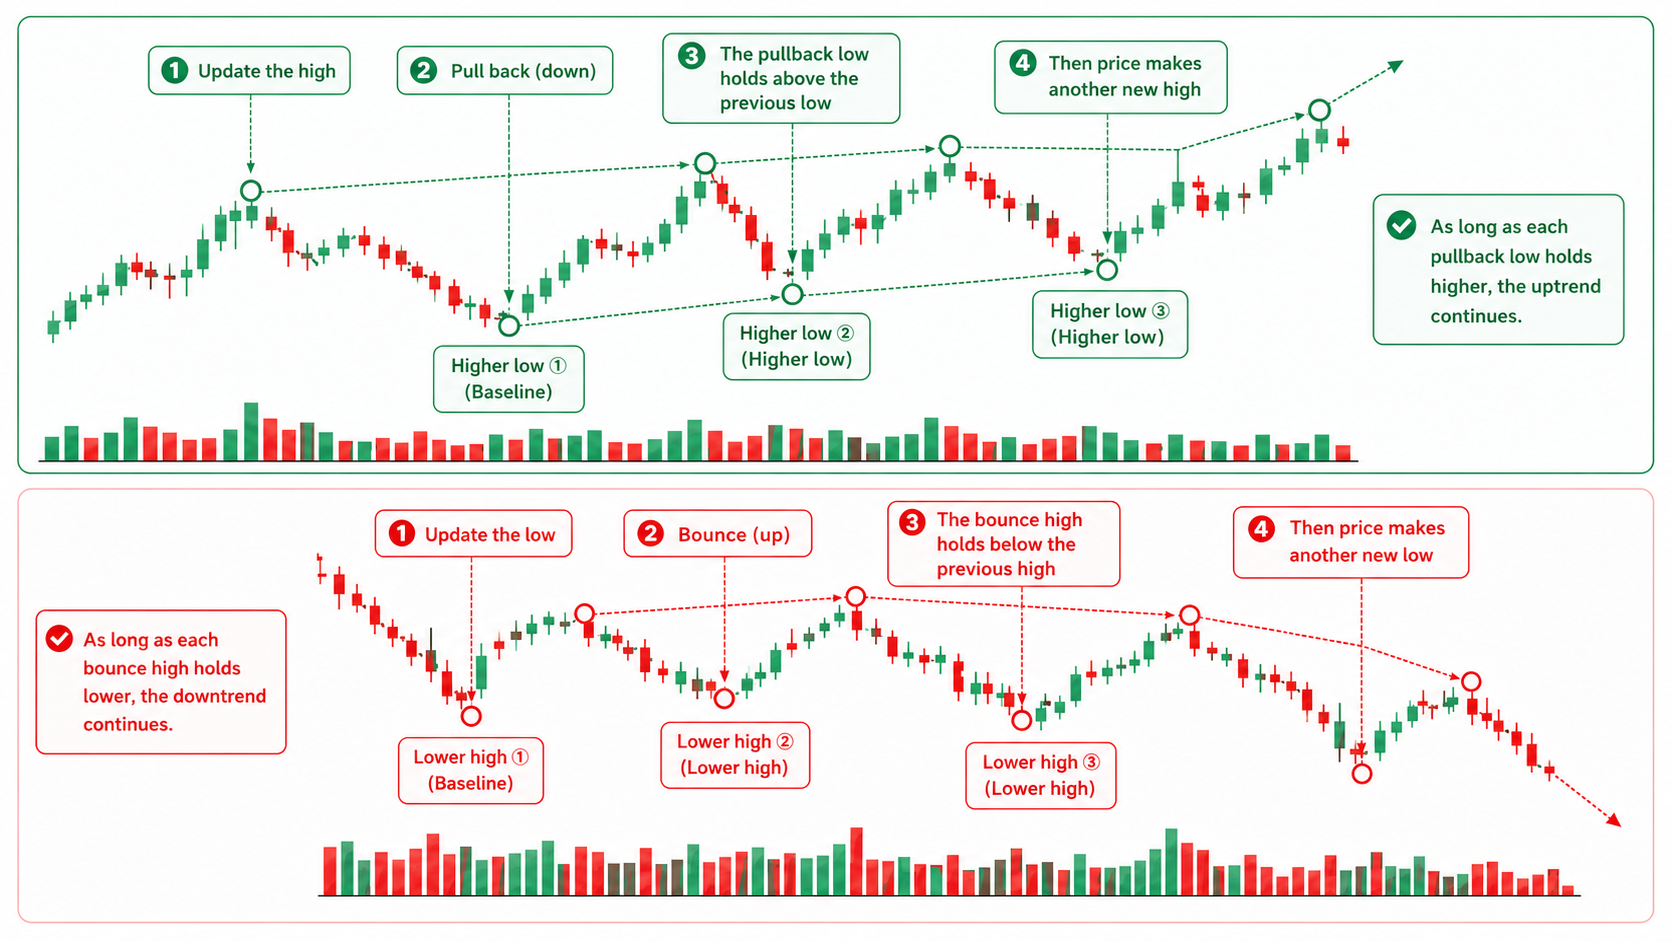
Price takes out a high → it pulls back (drops) → that pullback low stops at a level higher than the last one → and price goes on to take out the high again
If this "pullback low that stopped and became the origin of the next higher high" sits higher than the prior swing low, you read it as rising structure — the uptrend is continuing. In a downtrend, you watch the opposite: whether the "swing high" where the bounce stopped is falling.
One thing to watch for is that which low you count as the "swing low" involves subjective judgment. An uptrend has drops of all sizes along the way, and which you count as "the swing low that marks the trend" changes whether you read the trend as continuing or broken. Counting even minor drops before a high has been taken out as swing lows makes your read waver. Decide your own standard for "a drop this size counts as a swing," and confirm through backtesting whether that standard works.
How you count swings
One of the biggest challenges in applying Dow Theory is how you count swings — that is, how you take one unit of an up-down move (a swing being the move from a high to a low, or from a low to a high). Count every candle wiggle as a swing point, and even a one- or two-bar move becomes a "lower low," making the structure look like it breaks down constantly. Count only the big swing points coarsely, and you're late to notice a reversal.
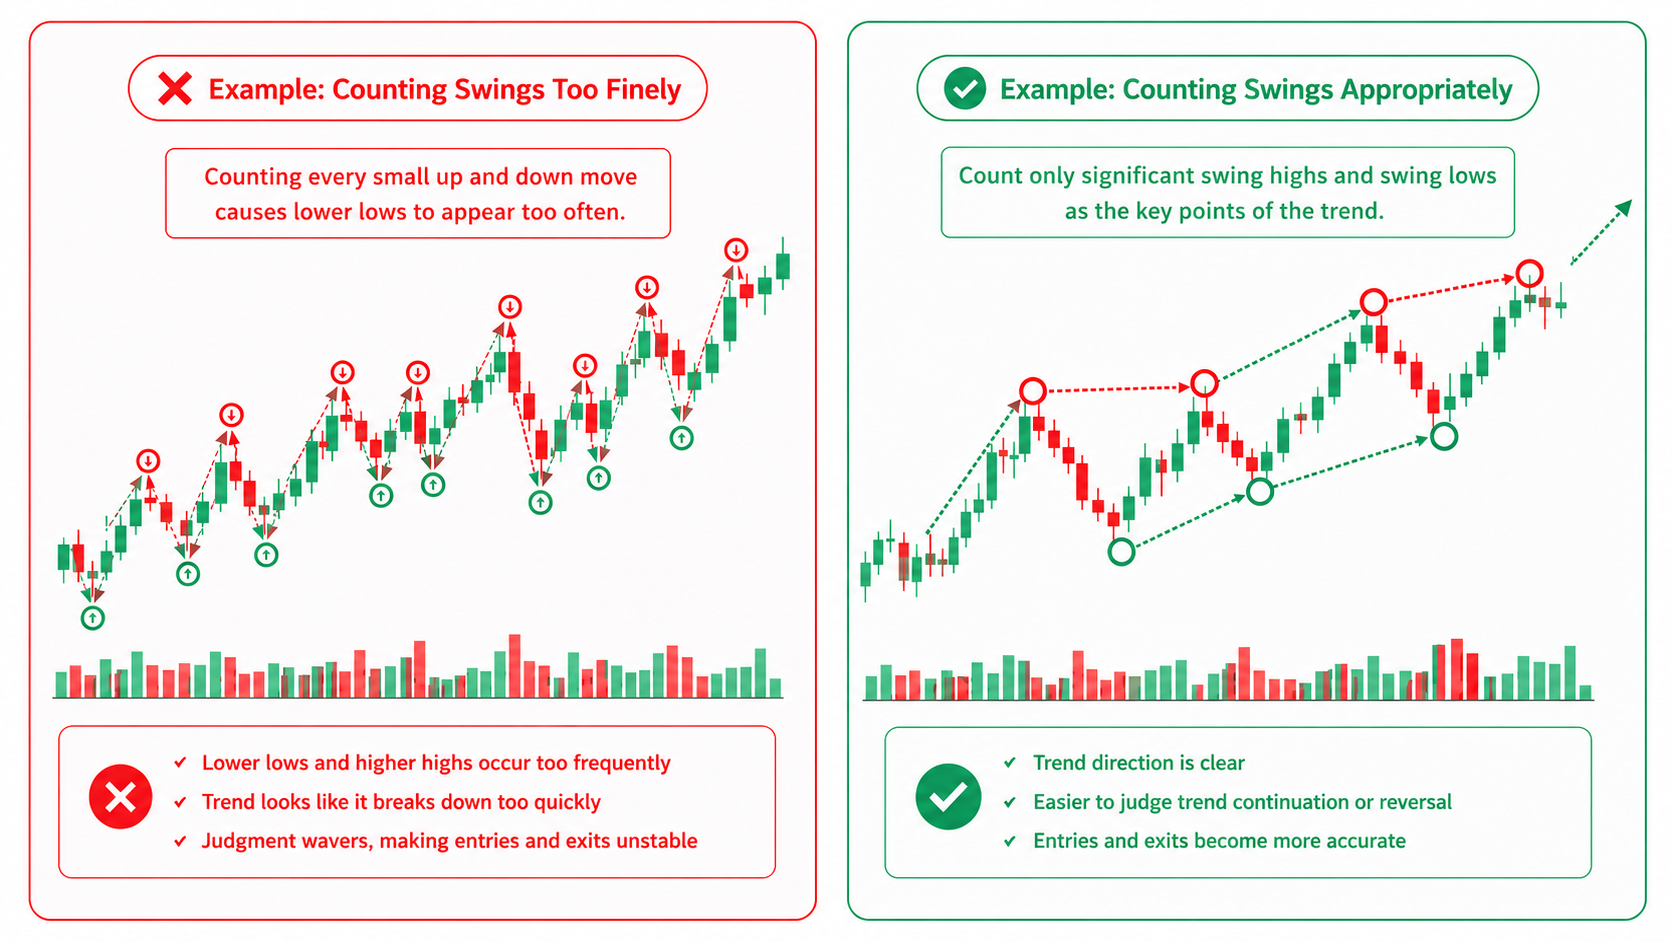
The catch is that there's no one-size-fits-all number for this. Whether you read daily or weekly, and whether the symbol is choppy or calm, changes the right way to count. Set your own count in a form like "the high/low within the last N bars," run backtests with that, and confirm your read of the trend doesn't waver — this kind of tuning can only be done through backtesting.
Trend reversal
The hardest call in Dow Theory is the reversal. Since an uptrend is defined by rising structure, when that structure breaks — specifically, the first time a confirmed swing low is broken inside an uptrend — that's seen as the first sign of a reversal. In a downtrend, it's the first time a confirmed swing high is taken out to the upside.
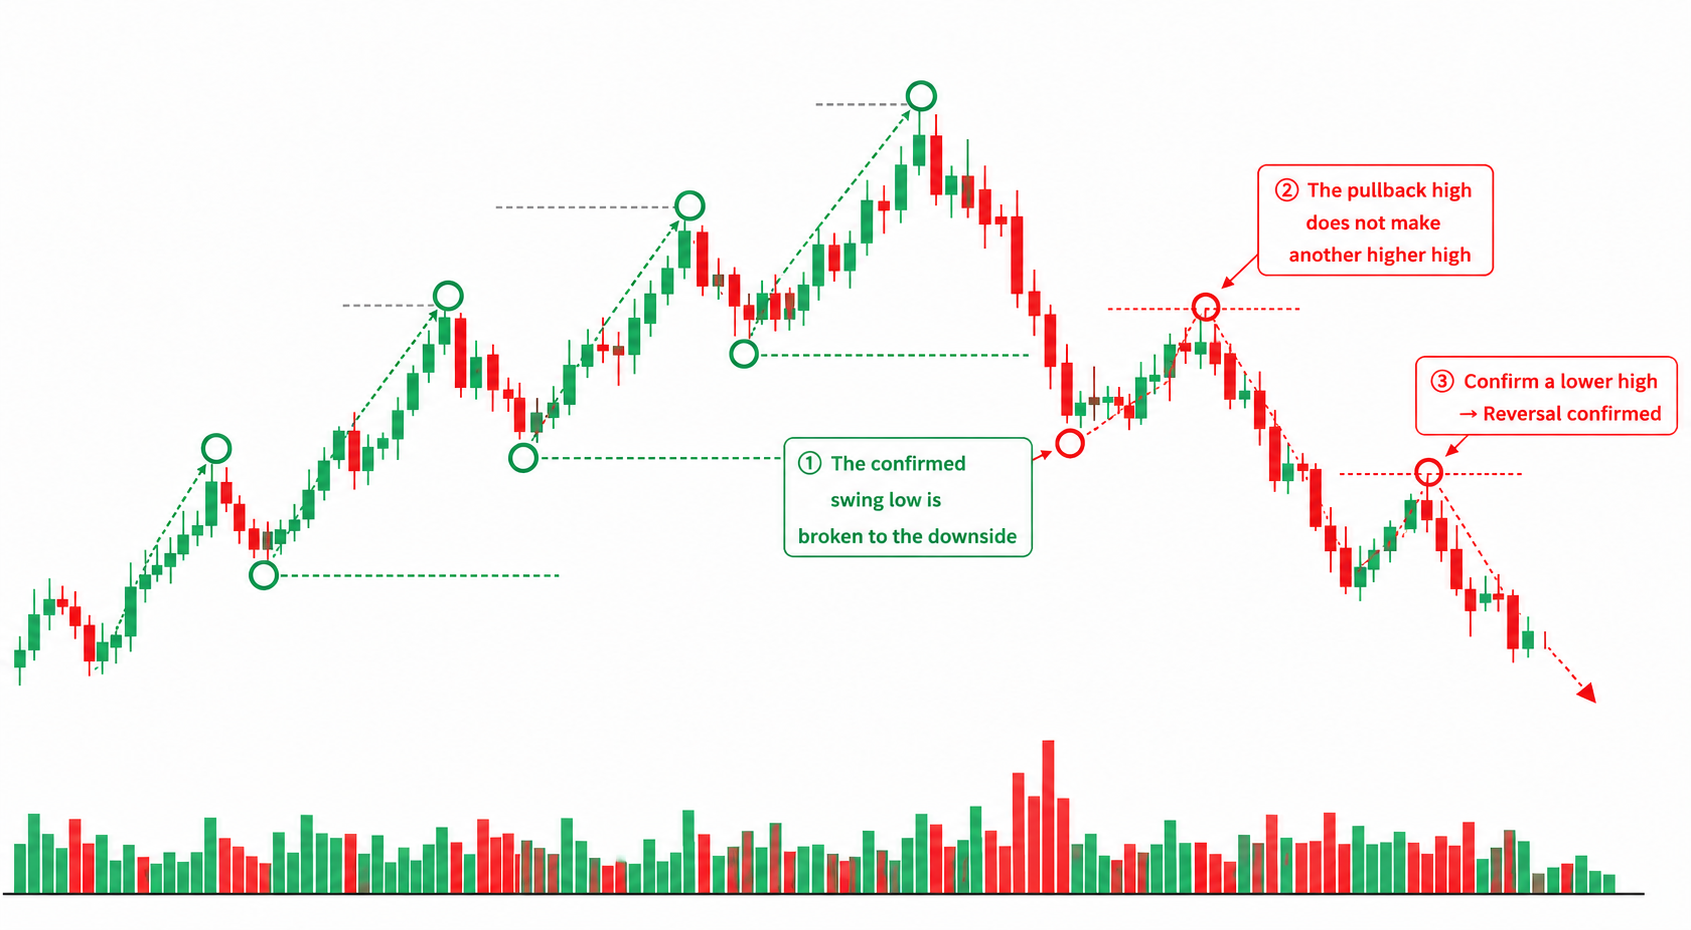
Keep in mind that "the first lower low" alone can't fully separate a real reversal from one deep pullback. Sometimes price just pulls back deeply and turns back up; sometimes it rolls straight into a downtrend. Often, people layer on extra conditions — confirming two stages, "a lower low plus a lower high after it," before calling a reversal. How far you confirm before calling it is something to get a feel for through backtesting: "with my standard, a reversal looks like this in spots like these."
Higher timeframe
Dow Theory works the same way on any timeframe, but trend direction can disagree across them. It's not unusual for the daily to be in an uptrend while the weekly is still in a downtrend. So a common use is to first check the higher-timeframe (daily, weekly) trend direction, then look for a trend in the same direction on the lower timeframe.
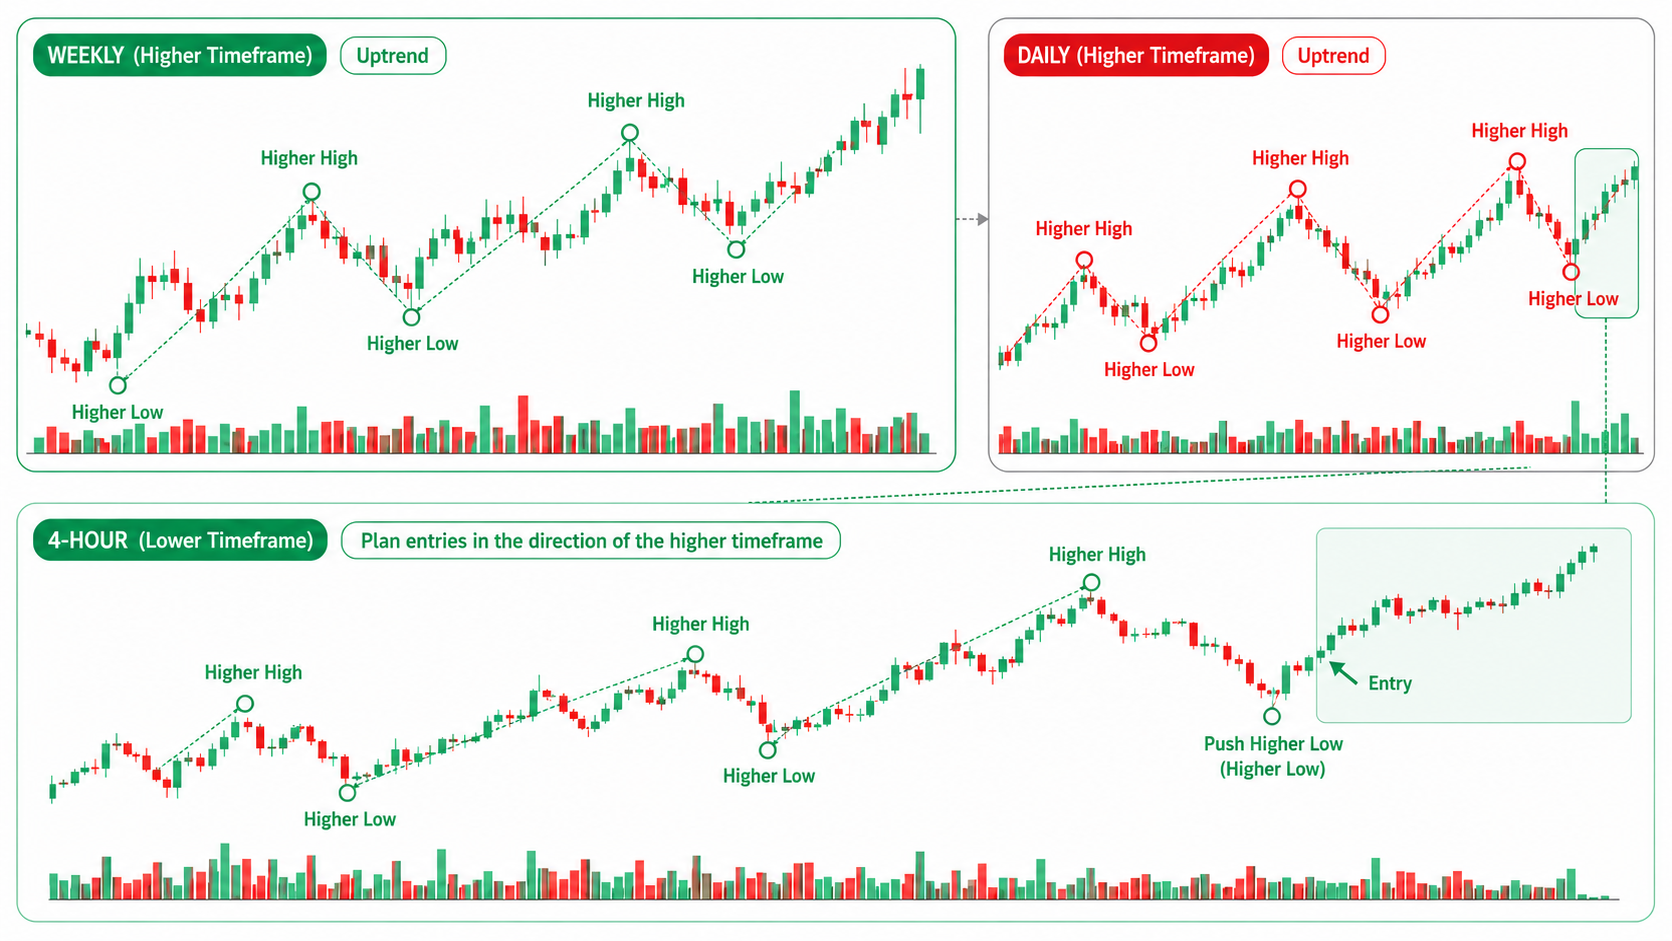
The challenge is that without deciding which timeframe you treat as "higher" and prioritize, the call gets muddled. When the higher timeframe is up and the lower is down, which do you follow? Commonly people prioritize the higher-timeframe direction and use the lower one to time the entry, but this split is also yours to settle as a rule and confirm through backtesting. With ENTRIQ you can step the daily and weekly forward together, checking the higher-timeframe direction while timing the entry on the lower one.
What matters here is that these focuses can't be pulled apart. Using them combined — "count the swing low within the recent swings, and only take it when it lines up with the higher-timeframe direction" — is the practical way. The more you combine, the stricter the call, but the fewer the spots where the conditions line up. Where you place yourself on that balance is also something to look at through backtesting.
How Dow Theory and trendlines relate
Dow Theory and the trendline get mixed up, but their roles differ. In a word, Dow Theory is a way of reading market structure; a trendline is a tool for drawing that structure as a line. The swing lows you read as rising in Dow Theory, connected with an actual line, are what a trendline is.
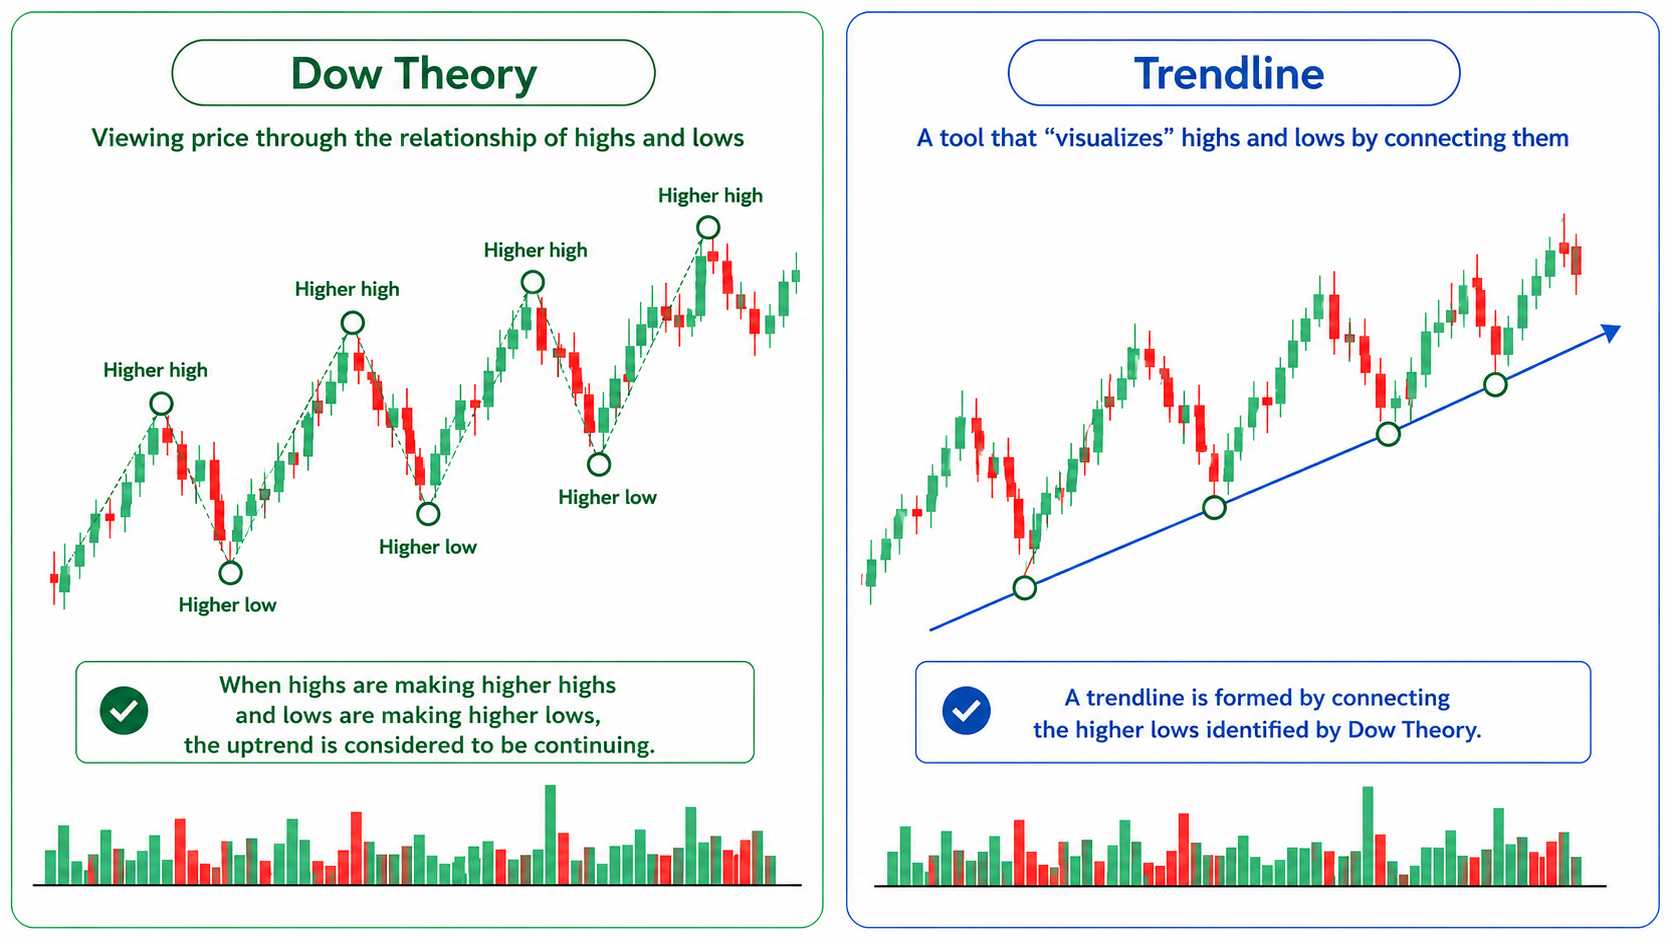
So the two aren't opposed — they're continuous. If you have the eye to read where the swing low is through Dow Theory, the anchor for drawing a trendline falls into place naturally. That's why many people use them together: Dow Theory as the underlying structure read, the trendline as the tool that makes the slope visible.
Rule the entry and the exit as a set
Dow Theory is the underlying judgment of "is there a trend," but that alone isn't a trade. It becomes a rule only once you've judged "the trend is continuing" and then decided where you get in and where you get out. And if you decide only the entry and not the exit, you can't make the call to exit when the trend breaks. Put the entry and the exit into words as a set.
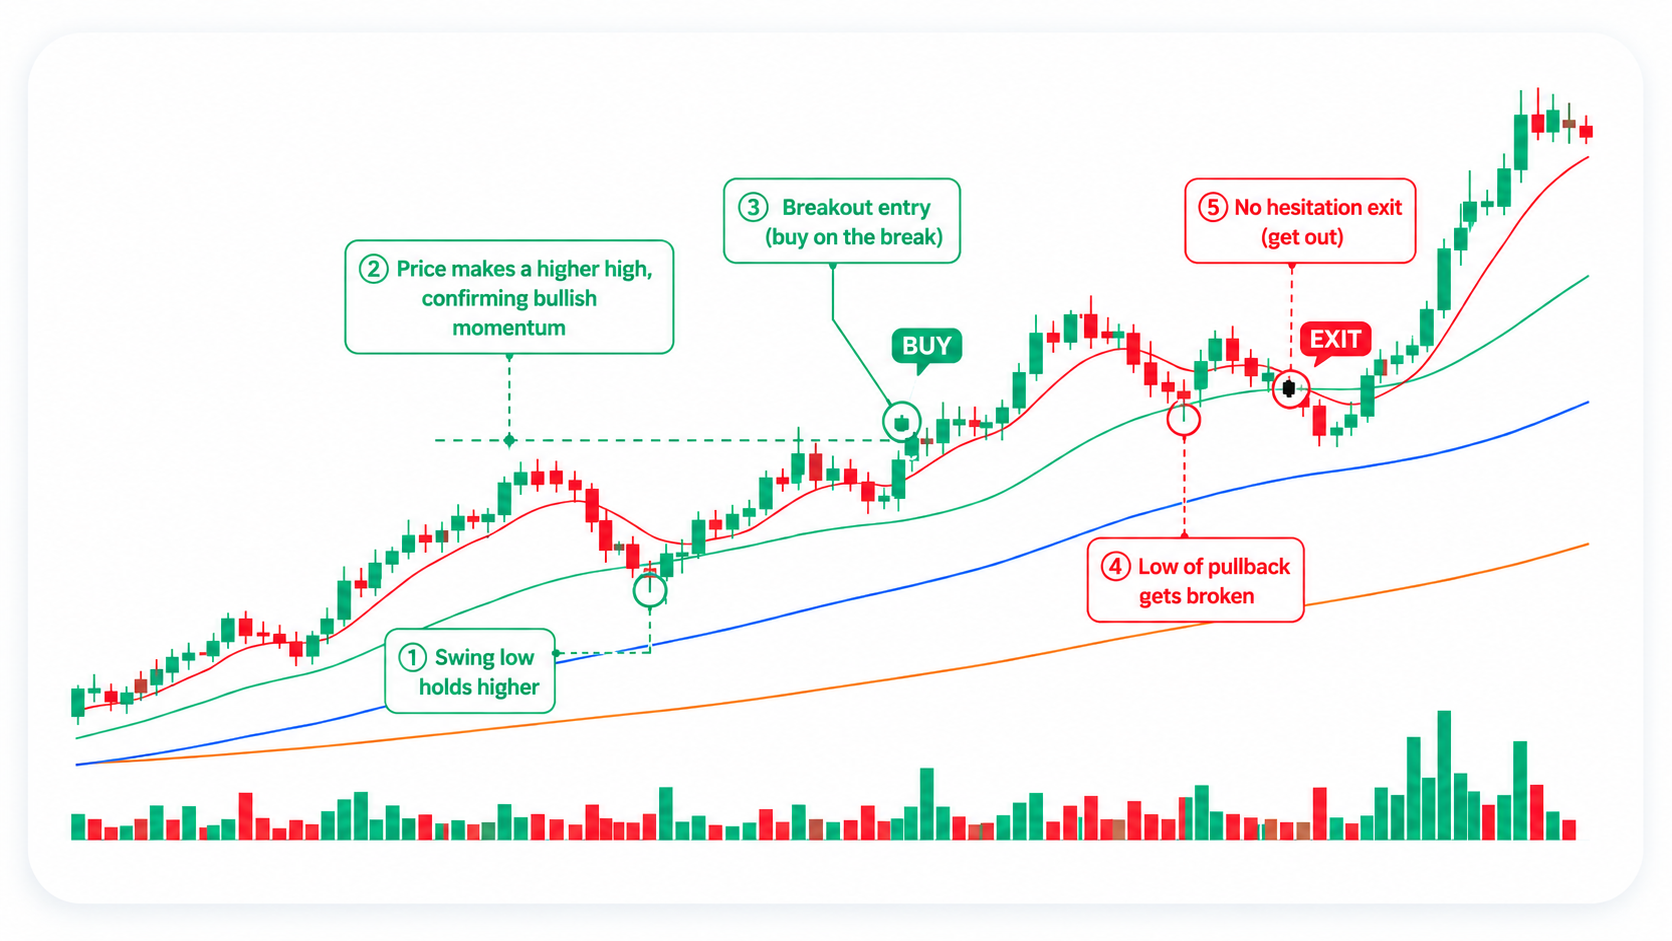
For a Dow Theory entry, there are ideas like "confirm the swing low has risen, then buy on the move that takes out the prior high" or "buy where price pulls back and turns back up." Both take "the rising structure is intact" as the premise for getting in.
For the exit, there's an approach that pairs well with Dow Theory. If the basis for the entry is "rising structure (= uptrend continuing)," then when that premise breaks — that is, when a swing low is broken — that's your line to exit the trade. It lines up with the reason you got in, so the call has consistency. When the reason to be in (the structure is rising) is gone, get out — deciding that correspondence first is the core of building rules with Dow Theory.
Strategy rule field: two patterns
ENTRIQ's strategy tags include a strategy rule field to write down. Putting your own trend-judgment standard into words lets you look back, each time you backtest, on whether you judged by the rule. There are broadly two ways to write it. Neither is better; pick the one that makes your judgment easier to reproduce.
Pattern A: Discretionary approach (define the situation in words)
The discretionary side. You define the context, entry, stop, exit, and skip conditions in words, without pinning them to numbers.
Context: An uptrend on the daily where the structure is making higher highs and higher lows. Confirm it also lines up with the higher-timeframe (weekly) direction. Entry: Confirm the swing low has risen above the prior one, then buy on the move that takes out the recent high. Stop: If the swing low it's based on is clearly broken, judge the uptrend premise has been invalidated and exit the trade. Exit: When the higher highs stall and the swing highs start to fall, consider taking profit. While the structure keeps rising, let it run. Skip: Don't enter in a range where the structure is crossing, or when the higher timeframe disagrees in direction.
Pattern B: Rules-based approach (state conditions in numbers)
The rules-based side. You fix the judgment in numbers so anyone reads the same conclusion. Because Dow Theory carries subjective judgment in counting swings, you back up the parts by stating the counting range in numbers, like "the high/low within the last N bars."
Target: A symbol where, within the last 30 bars, the swing low sits above the prior swing low. Entry: Buy when price closes above the last 15-bar high. Stop: Exit if price breaks below the recent swing low (or −2%). Take profit: Take half off at +6%; hold the rest until a swing low is broken. Filter: The structure is rising on the higher timeframe (weekly) too.
Numbering makes the review quantitative and easier to aggregate in backtesting. That said, the numbers here — 15 bars, 30 bars, −2%, +6% — are only a sample of how to write it, not a guarantee of effectiveness or profit. Backtest on your own symbols and timeframe and adjust while watching the data.
Test, record, and review
Once your rules are in words, pick spots on a past chart where a trend is running, and repeat virtual entries and exits with the future hidden. Each time, leave "did I identify the structure by the rule" and "how I spotted the reversal" in your trade journal and strategy tags.
One strategy tag per trade. Tag it something like "Dow Theory — rising swing low," and you can later pull just the trades on that one rule and check win rate, profit and loss, average risk-reward ratio, and so on across them.
The thing to watch here: while the sample is small, don't take the numbers at face value. Deciding whether a standard is good or bad on 5 or 10 results is too soon. Bank the repetitions through risk-free backtesting first, then look at the pattern.
The chart above is a sample showing how the data "appears" when you backtest with different standards (not real data). With the same Dow Theory, changing how you count swings or the higher-timeframe condition changes the data — confirming that difference with your own hands is the point of backtesting.
The records you build up can also be reviewed with AI analysis. AI analysis isn't a buy/sell signal or a recommendation; it describes, in words, the patterns observed across your past trade data and notes. It's material for surfacing patterns you'd miss on your own — like "the trades where I misjudged the reversal often have 'counted swings too finely' in the notes."
Four common mistakes
- Picking up too many minor swings: Counting even one- or two-bar moves as swing points makes you read "it broke down" constantly while the trend is still running. Decide how you count swings first.
- Jumping in or out without confirming the reversal: Calling a reversal on the first lower low alone leaves you whipsawed by deep pullbacks. Decide how far you confirm before calling it.
- Judging on the lower timeframe without checking the higher one: An uptrend on the lower timeframe can be just a bounce if the higher timeframe is in a downtrend. Check the higher-timeframe direction first.
- Counting swings differently every time: Counting finely one time and coarsely the next leaves you unsure what you were even testing. Run the same count through and put in the repetitions.
FAQ
Q. Is Dow Theory hard for beginners? A. Since it's just watching whether the structure is rising or falling, the idea itself is easy to grasp. What's hard is which swing points you count, and spotting the reversal. Decide your counting and reversal standards first, as in this article, and put in the repetitions through backtesting — beginners can build it into their own trend read too.
Q. How do Dow Theory and trendlines differ? A. Both read trend, but Dow Theory identifies it from market structure alone, while a trendline connects lows or highs with a line to see the slope. The swing lows you read in Dow Theory, connected with a line, are what a trendline is — they're continuous, not opposed. Plenty of people use them together.
Q. Any tips for spotting swing lows and swing highs? A. Decide in advance how big a pullback (or bounce) you count as a swing point. Without a standard, your read becomes inconsistent on the same chart. Fixing your count in a form like "the low/high within the last N bars" and confirming through backtesting that the count works is the reliable way.
Q. How should I determine a trend reversal? A. In an uptrend, the first time a confirmed swing low is broken is the first sign. But that alone can't separate a deep pullback, so many confirm two stages — "a lower high after it too" — before calling a reversal. How far you confirm is yours to lock in as a standard through backtesting.
Q. Can you trade using Dow Theory alone? A. Dow Theory alone can determine the direction of a trend, but many traders time their entries and exits by combining it with other elements — the moving average, the trendline, volume, and so on. Which combination fits you is something to confirm through backtesting.
Q. Which symbols can I practice Dow Theory on? A. ENTRIQ's backtesting supports US stocks, FX, commodities, and crypto. Japanese stocks are planned for a future release. You can also test while watching multiple timeframes at once, so it works for practicing with the higher-timeframe direction in mind. Some pair entries during a trend with tools like the moving average.
Dow Theory isn't a framework for predicting "up or down next." It's a way to determine, objectively, whether the current trend is still running or starting to break down. Understanding it as knowledge alone won't steady your judgment. Locking down that standard — which swing points you count, where you call a reversal — and confirming it again and again on past charts is what makes your trend analysis consistent and repeatable. Write the counting and reversal standards as a set in the strategy rule field, and confirm them on past charts over and over.
ENTRIQ is a stock practice and backtesting tool for individual traders, combining chart replay, trade journaling, and AI analysis.
This article does not guarantee the effectiveness or profitability of any method or rule. The numbers and examples shown are samples to illustrate how to write rules, not indications of investment results. You are solely responsible for your own investment decisions.
Reproduce this validation yourself
With ENTRIQ's chart replay, you can trade through past charts using the same rules.
Start 14-day free trialValidate your method on past charts
The same validation in this article can be reproduced with your own method. On past charts, do the classics really work?
- ✓ Replay past charts
- ✓ AI feedback on your trades
- ✓ Validate methods with statistics