Moving Average Strategy|Slope, Crossovers, and Backtesting
Turn a moving average's slope, crossovers, and bounces into rules, handle whipsaws and ranges, and backtest it on past charts. Includes two sample rules.
The moving average (MA) is the most familiar indicator there is — it's already on almost every charting tool by default. Which is exactly why so many traders have one sitting on the chart without a clear idea of how to actually use it for decisions. You've heard "buy the golden cross, sell the death cross," but pull up a past chart and you'll notice how often price reverses right after a cross — far more whipsaws than you'd expect.
This article is a deep dive on the moving average, one of the setups listed in 8 Core Trading Strategies Explained. We'll cover how to read an MA (slope, the relationship between multiple lines), how to use it as a setup (crossovers, bounces off the MA), how to deal with ranges and whipsaws, and how to write it into ENTRIQ's strategy-rule field (with two sample entries). This isn't about predicting where price goes. It's about putting your rules into words so you can test them on past charts, over and over.
What a moving average is
A moving average is a line connecting the average of closing prices over a set period. A 20-day MA (20MA), for example, plots the average of the last 20 closes at each bar, smoothing out the small ups and downs so the underlying flow is easier to see. A shorter period reacts more sharply to price; a longer one moves slowly and shows the bigger picture.
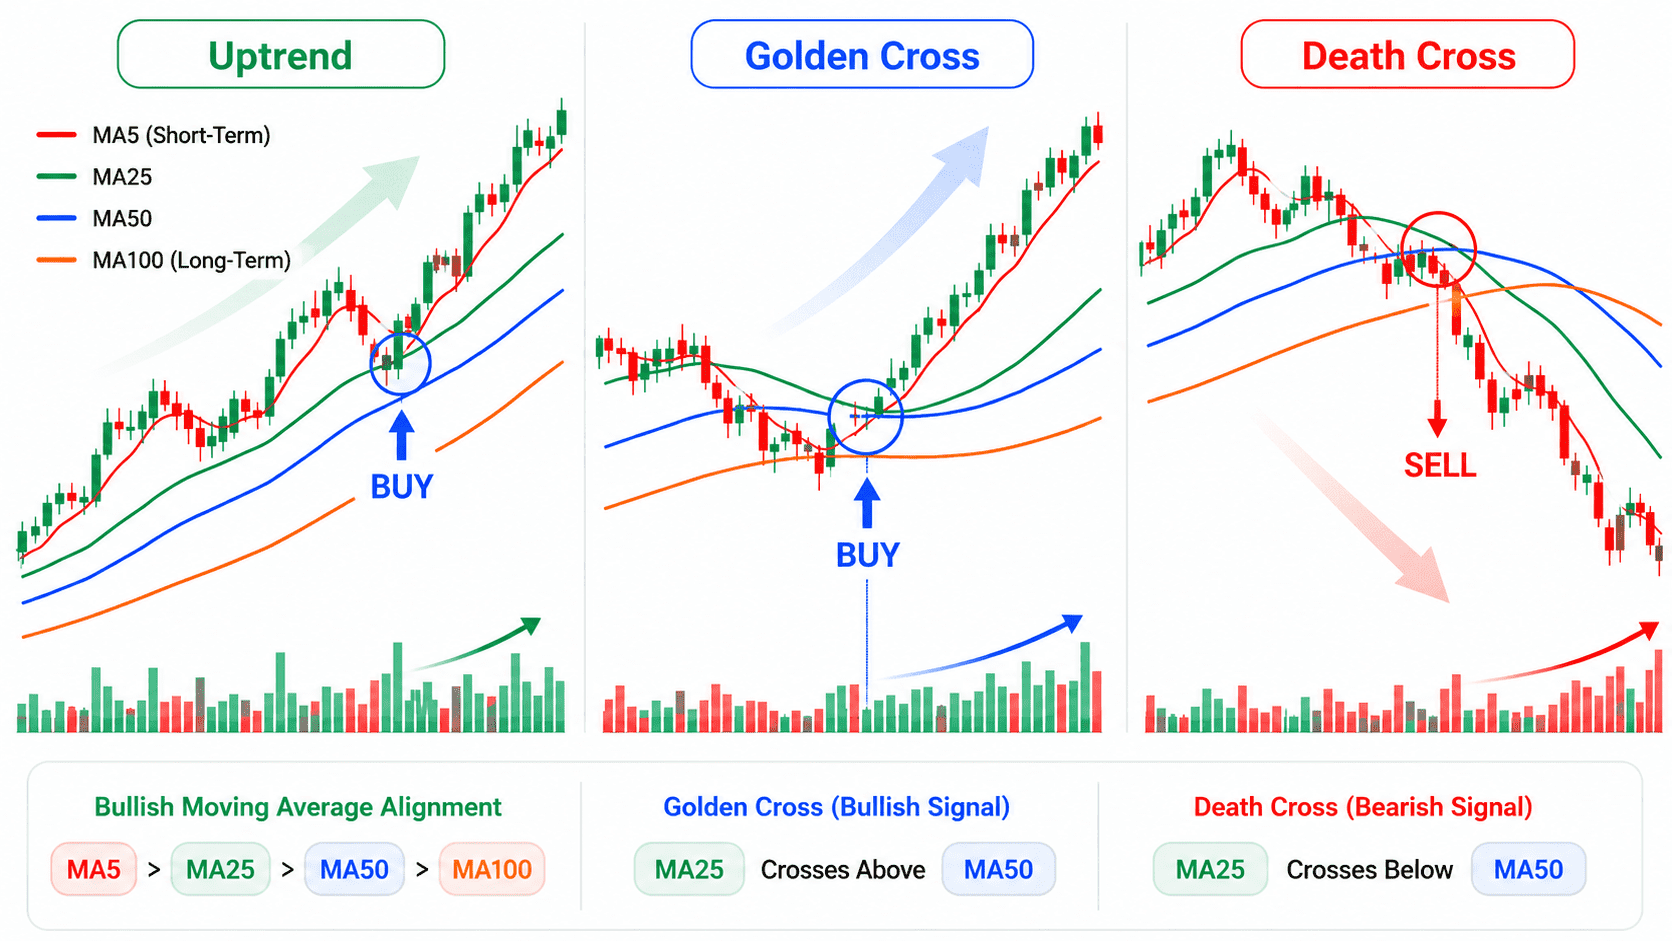
MAs are a common foundation for setups because they show trend direction and momentum at a glance. An upward-sloping MA suggests an uptrend, a downward-sloping MA suggests a downtrend, and a flat MA suggests a lack of directional bias — that read is more intuitive than staring at price alone. Stack multiple periods (short, medium, long) and the strength of the flow, and early signs of a turn, become easier to read.
A moving average plots the average of past closes — it isn't a line that shows the future. It's a tool for smoothing the flow so far into something easier to read.
Using a moving average as a setup
Here are the common ways traders use MAs for decisions, laid out neutrally. We don't call any one correct. Which you adopt is something to verify with your own backtest.
| Use | The idea | Watch out for |
|---|---|---|
| Slope of the line | Read trend direction and momentum from whether the MA points up or down, steeply or gently | In flat phases the slope flips often and is hard to read |
| Price relative to the MA | Use whether price is above or below the MA as a bullish / bearish gauge | When price hovers around the MA, signals pile up |
| Crossover (two MAs) | Treat a short MA crossing above (golden cross) or below (death cross) a long MA as a turn | Crossovers lag, so you miss the start of the move |
| Bounce off the MA | In a trend, target where price pulls back to the MA and bounces | Which MA price respects varies by symbol and timeframe |
| Stacked order | Confirm a strong trend when lines line up cleanly (short > medium > long for an uptrend) | Hard to judge once a clean stack starts breaking down |
Let's look at each use a little more concretely.
Slope of the line
The simplest use is reading the MA's own direction and slope. Rising left to right means an uptrend, falling means a downtrend, flat means no clear direction — a read you get at a glance without chasing every jag in price. Add to that: the steeper the slope, the stronger the momentum; the gentler, the weaker. In trend-following setups, slope is often the first filter — it tells you whether the backdrop even allows an entry before you look at anything else.
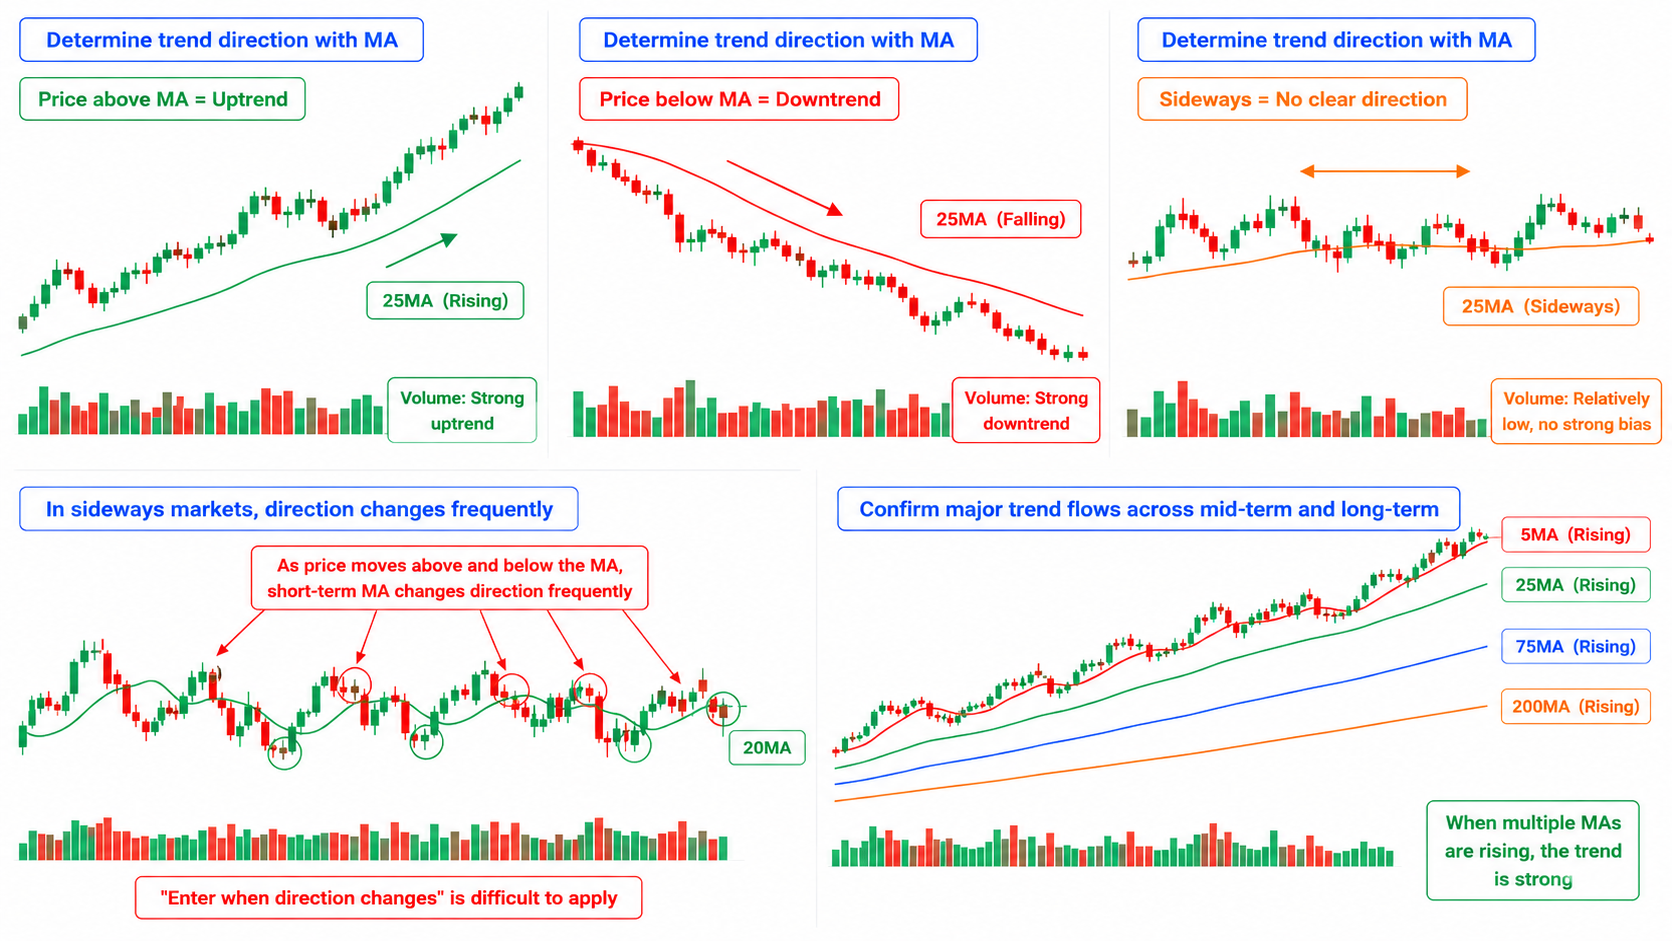
The catch is that slope flips constantly in a range. When price chops across the MA, a short line like the 20MA keeps turning up and down, and "the slope changed, so I'll enter" backfires. If you trade off slope, read the medium and long lines alongside the short one and confirm the larger flow has a settled direction — that keeps you from getting jerked around.
Price relative to the MA
This uses whether price sits above or below the MA as a rough bullish / bearish gauge. "Bullish bias while price is above the 20MA; stand aside once it cuts below" is a typical way to draw the line on whether to stay in. Combined with slope, the common read is "the trend continues while price trades above an up-sloping MA."
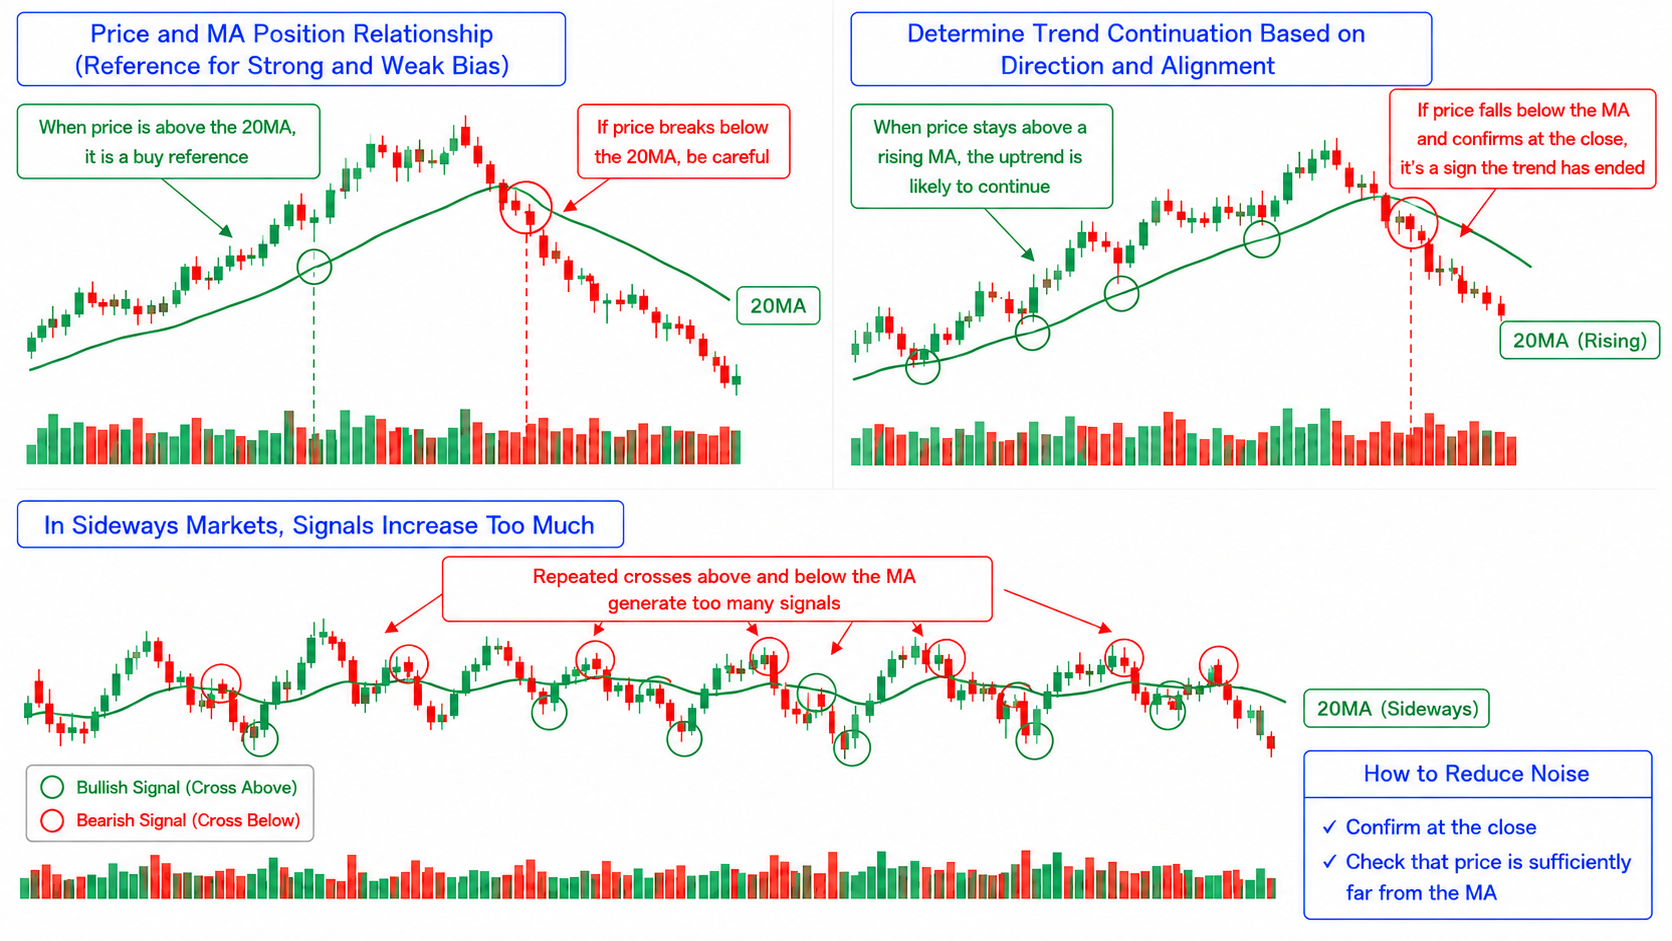
But when price hovers around the MA, breaks above and below fire over and over and the signals pile up. Price nudges above, then drops right back under, again and again — reacting to each one wears you out. To use the position read, you need ways to cut the noise: require a close beyond the MA, or check whether price has pulled a set distance away from it.
Crossover (two MAs)
Here you stack two MAs of different periods and treat the short MA crossing above the long one (golden cross) or below it (death cross) as a turn. Put a 20MA and a 50MA on the chart, and a 20MA crossing above the 50MA reads as a turn to an uptrend, below it a turn to a downtrend. It's a clear visual signal — two lines crossing — which makes it one of the best-known uses.
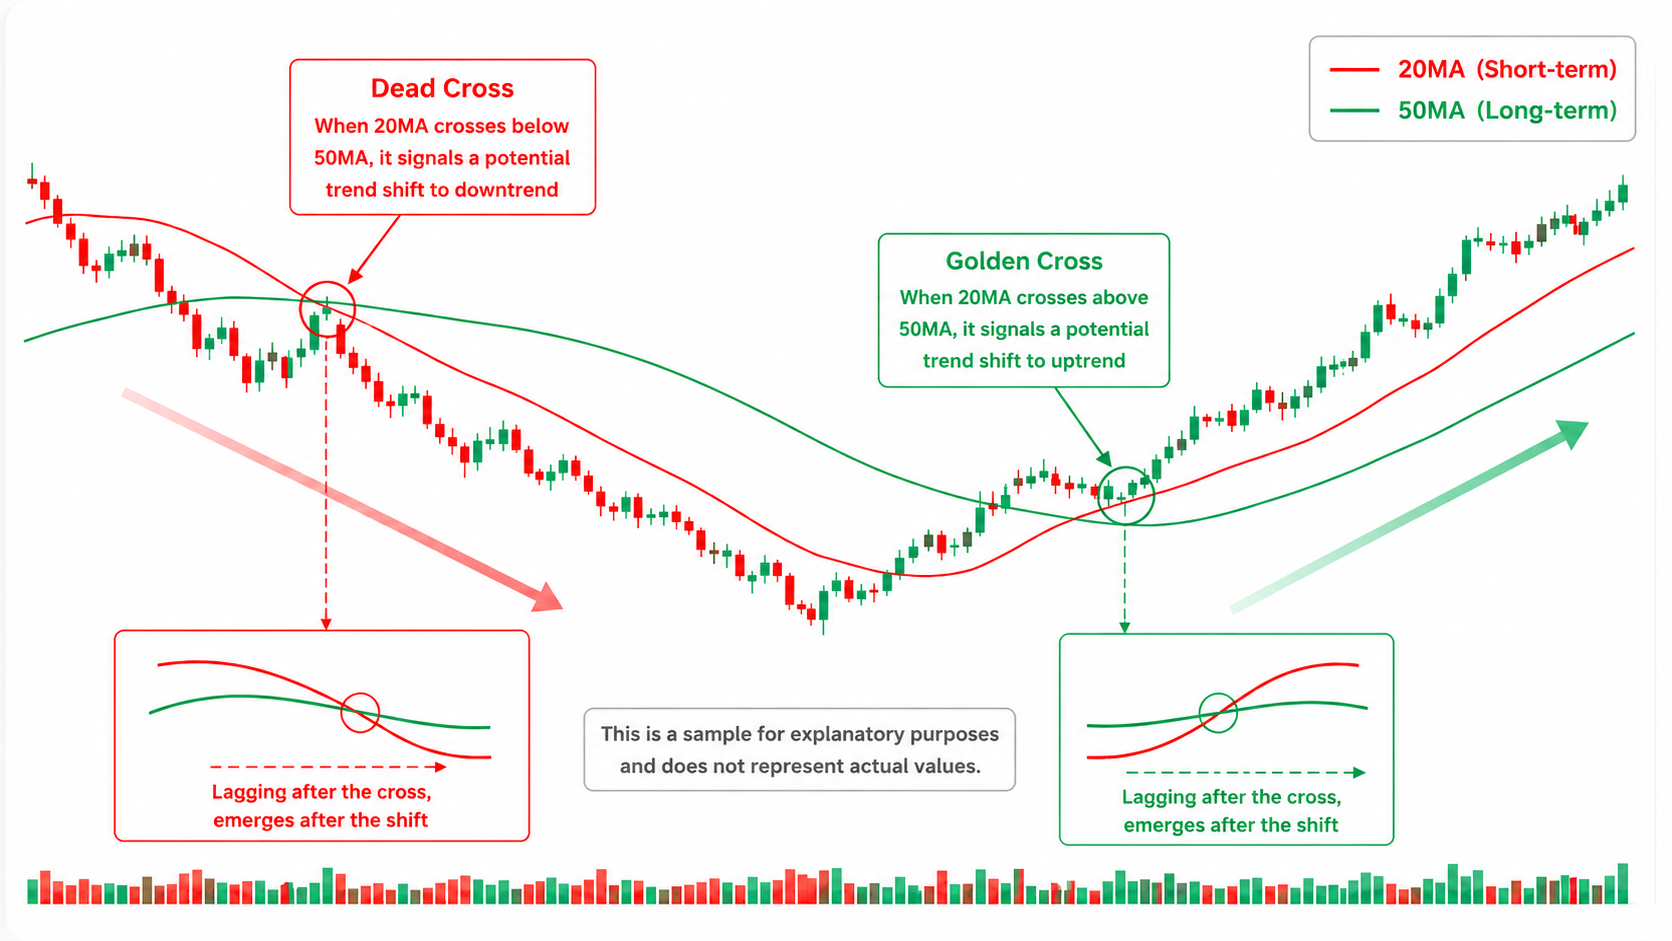
The biggest catch is that crossovers lag. Because an MA is the average of past closes, there's a gap between price turning and the cross actually forming, so you miss the start of the move. And when there's no trend, price snaps back the other way right after the cross — a whipsaw — constantly. If you use crossovers, you have to run them with that lag and those whipsaws in mind, paired with a trend check and a stop.
The line above sketches price falling and then recovering (a conceptual sample). A death cross tends to form partway into the drop and a golden cross after the recovery — and putting it in a chart makes the point intuitive: both show up late, after the turn has already happened.
Bounce off the MA
In an ongoing trend, this targets the spot where price pulls back (or rallies back) to the MA and then bounces back in the trend's direction. In an uptrend, that means buying where price drops to an up-sloping 20MA or 50MA and finds support. You're treating the MA as a support / resistance gauge, and the upside is entering at a favorable price in the trend's direction. This is essentially the same idea as using the MA as your depth gauge in buying the dip and selling the rally.
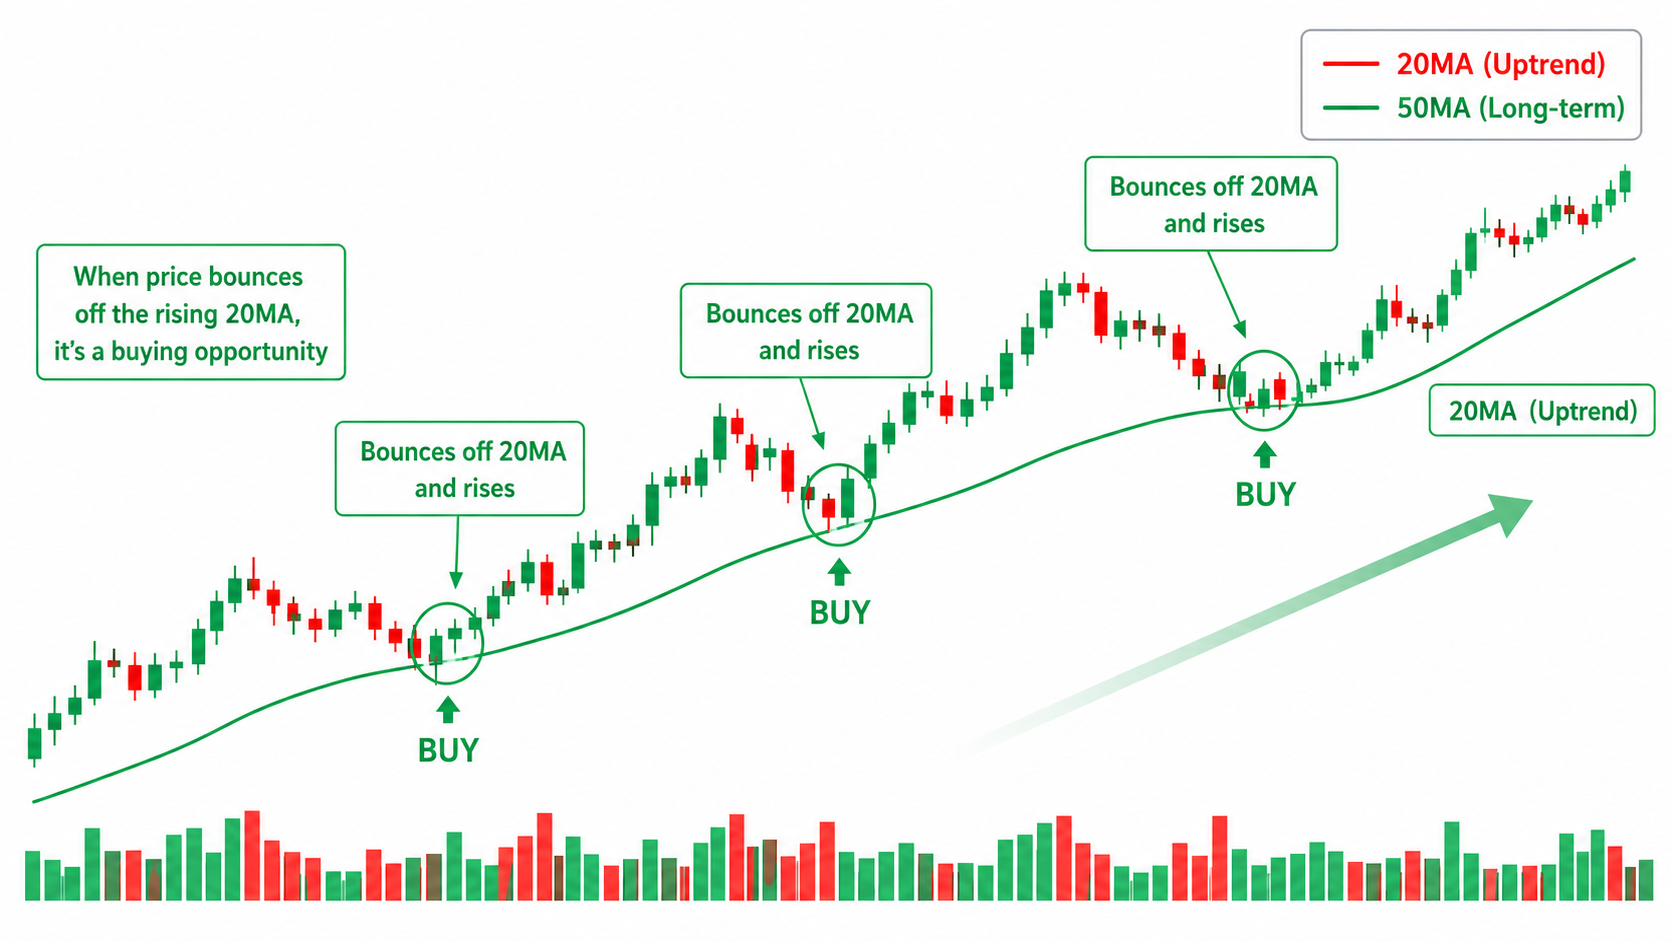
The catch is that which MA price respects varies by symbol and timeframe. One symbol bounces cleanly off the 20MA; another pulls all the way to the 50MA before bouncing — both happen routinely. "Which MA tends to work on this symbol, this timeframe" is something you can only settle by backtesting. Whether you wait for confirmation (a lower wick or a bounce bar) or enter on the MA touch also changes your entry location and your trade count.
Stacked order (perfect order)
Here you stack three or more MAs — short, medium, long — and use a clean arrangement, short > medium > long (uptrend) or short < medium < long (downtrend), to confirm a strong trend. The more the lines fan out in the same direction, the more momentum the trend has, and the more you can read participants across timeframes as facing the same way. Trend-following setups use it as a high-confidence gauge of "is this a strong enough trend to ride."
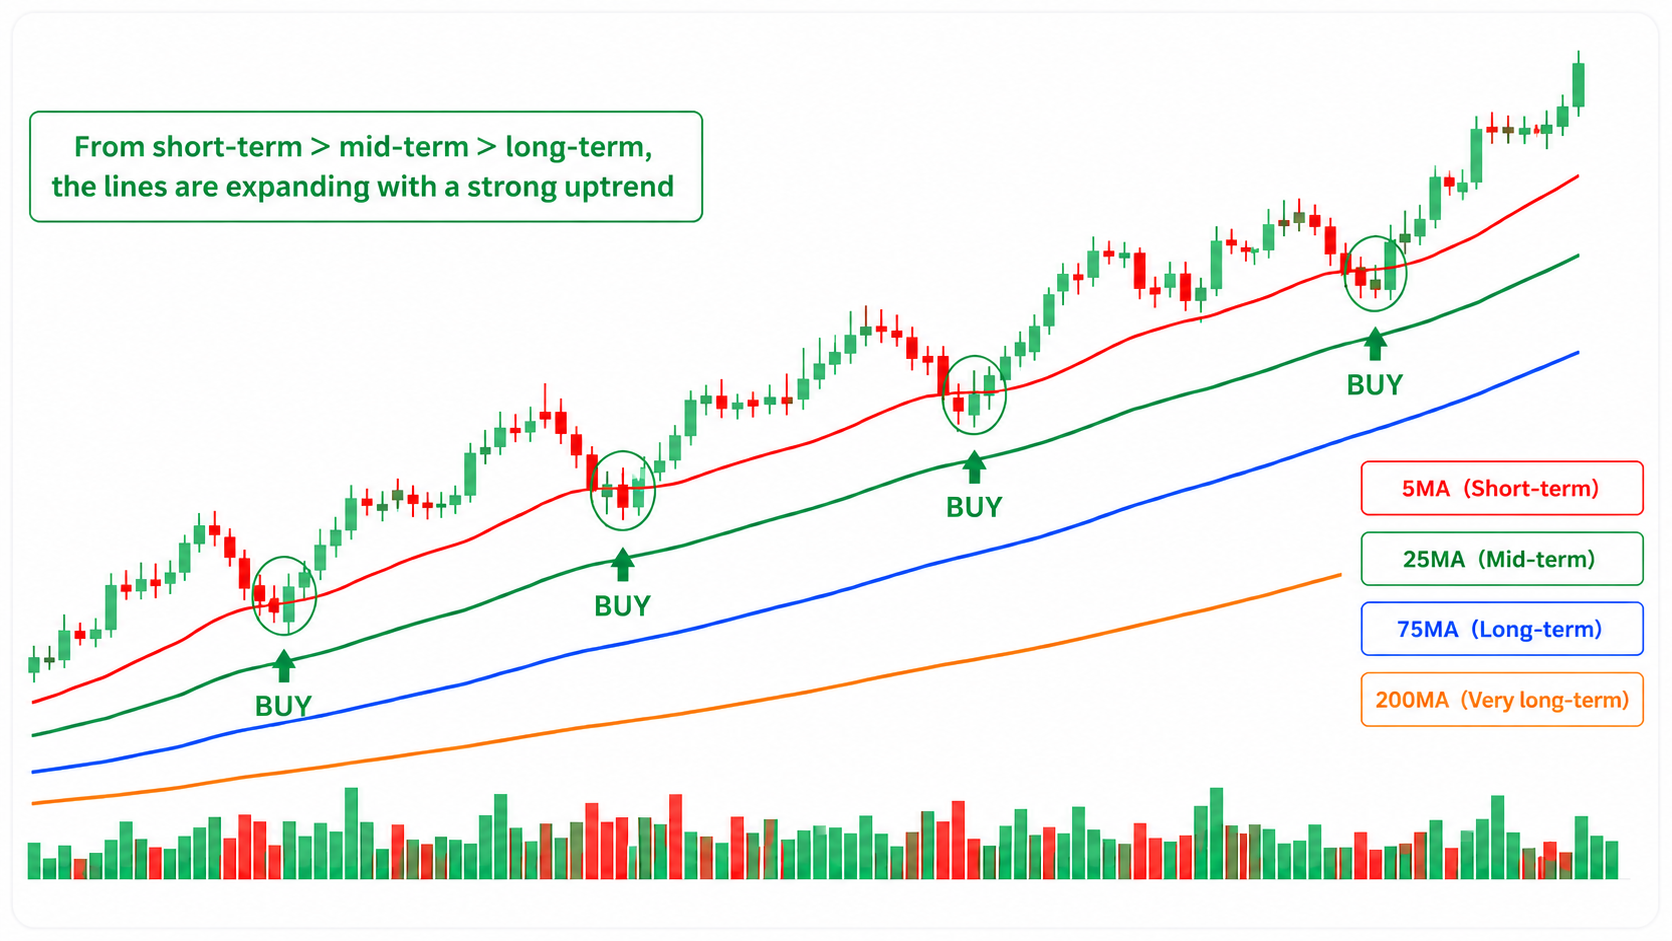
The thing to watch is judging what happens once the order starts to break. A clean stack always eventually frays, but whether that "start of the fraying" is a temporary pullback or the doorway to a real reversal is hard to tell in the moment. Unless you rule out the breakdown in advance — exit the moment the order breaks, or shift to caution once the short line cuts the medium — you can fail in both directions: missing only the end of a strong trend, or holding too long and giving back profit.
The key point: these aren't mutually exclusive. Traders commonly combine them — "the line slopes up and price pulls back to the MA and bounces, then buy." Using a bounce off the MA overlaps with the idea behind buying the dip and selling the rally. How you combine them is, in effect, your setup.
Dealing with ranges and whipsaws
The most common stumble with moving averages is using them in a directionless range. When price chops back and forth across the MA, crossovers and slope flip constantly, and following every signal means trading in and out and stacking up losses. You have to accept the MA as a tool that works best when there's a trend and poorly in a range.
A crossover "whipsaw" has the same root. A golden cross, price drops, and you're right back to a death cross — that back-and-forth shows up constantly when there's no trend. That's exactly why the prep work matters: confirm there's a trend before you act on an MA signal, and pick a period and number of lines that fit the timeframe you trade. Which settings fit your market isn't something you decide by arguing about it. It's something you backtest.
Why backtest it
The MA changes completely — in look and behavior — depending on the period you choose (5, 20, 50, 75, 200…), how many lines, and how you use it (crossover, bounce, or slope). "A 20/50 crossover" and "a bounce off the 20MA" give you different entry counts and different entry locations entirely. Which combination fits the symbols and timeframes you trade is something you can only settle through repeated testing.
This is where chart replay (backtesting) earns its place. You put an MA on a past chart, step through it one bar at a time, and decide "would I enter here?" without seeing what comes next. You're using virtual funds, so there's no real loss, and you can swap "period 20" for "period 50" over the same stretch and compare. Because the MA has so much settings flexibility, there's particular value in using backtesting to narrow down the settings that fit you.
Define entries and exits together
With MAs too, most mistakes come from setting an entry condition and skipping the exit. Always put entries and exits into words as a pair.
Entry (when you get in)
- Which MA / how many lines you use (20MA alone / a 20/50 crossover)
- What counts as the signal (a crossover / a bounce off the MA / price closing above the MA)
- How you confirm there's a trend first
Exit (when you get out)
- Stop: the price that invalidates the signal (price clearly breaks the MA the other way / breaks the origin of the bounce)
- Target: where you take profit (the next level / a fixed distance / hold until price closes back through the MA)
If you tie your stop to the MA — "if price closes back through the MA I leaned on, I'm out" — the decision to exit is less driven by emotion. When the reason you entered (the MA-based trend continuing) breaks, you exit. Setting up that pairing first is the core of building an MA rule.
Sample strategy-rule entries (two patterns)
ENTRIQ's strategy tags include a strategy-rule field where you write down your own rules. Putting how you use the MA into words there lets you check, after every backtest, whether you actually entered the way you planned. There are two broad ways to write them. Neither is better — pick whichever lets you reproduce your decisions more reliably.
Pattern A: Discretionary (define the situation in words)
The discretionary style. You define context, entry, stop, exit, and skip conditions in words, without locking them to numbers.
Context: The moving average clearly slopes up and price trades above it — an uptrend. Don't use it when the MA is flat and price chops around it. Entry: Buy when price pulls back to the up-sloping MA and prints a bounce bar. Stop: If price closes clearly below the MA I leaned on, call the trend continuation broken and exit. Exit: Consider taking profit at the next level. If the trend continues, scale out part and let the rest run. Skip: Don't enter when the MA is flat, or right before major data releases.
Pattern B: Rules-based (spell the conditions out in numbers)
The rules-based style. You fix the decision with indicators and numbers, so anyone reading it reaches the same conclusion.
Context: 20-day MA > 50-day MA, and the 50-day MA slopes up (treat as an uptrend). Entry: Price pulls back to the 20-day MA, and the day closes back above the 20-day MA. Stop: Exit if the close is below the 20-day MA (or −2%). Target: Take half off at +6%, hold the rest until the close drops below the 20-day MA. Filter: The 50-day MA must be sloping up (pass when flat or down).
Numbers make your review quantitative and easier to aggregate in a backtest. But the figures here — 20-day MA, 50-day MA, −2%, +6% — are only examples of how to write a rule. They don't guarantee any edge or profit. Backtest them on your own symbols and timeframes, and adjust as the data tells you.
Test it, then record it
Once your rules are in words, put an MA on past charts and run virtual entries and exits without seeing the future. After each one, log whether you entered by the rule and whether you forced the MA in a range in your trade journal and strategy tags.
One strategy tag per trade. Tag it something like "20MA bounce – trend," and you can later pull up just those trades to see win rate, P&L, average risk-reward, and so on across the whole setup.
A caution here: don't take the numbers at face value while your sample is small. Judging a rule on 5 or 10 trades is far too early. Build up enough repetitions in risk-free backtesting first, then look at the pattern.
The chart above shows how the data might look when you test different ways of using the MA (it's sample data, not real results). Same moving average, different period or method, different numbers — seeing that difference for yourself is the whole point of backtesting.
You can also review what you've logged with AI analysis. AI analysis isn't a trade signal or a recommendation — it identifies and describes patterns from your past trade data and notes. It can surface things you'd miss on your own, like "the trades I entered on crossovers were often in ranges and stopped out a lot."
Four common mistakes
- Using the MA in a range. Following crossovers or slope in a directionless market means getting whipsawed and stopping out repeatedly. Confirm there's a trend first.
- Entering with no stop. Crossovers come with whipsaws. If your exit isn't tied to the MA, a failed signal can run your loss wide.
- Changing the MA period on a whim. Tweaking the period every time something doesn't work makes it impossible to know what you tested. Build up the repetitions on one setting before you revisit it.
- Treating the MA as a crystal ball. An MA is the average of past closes, not a line that predicts what's next. Keep its role to "confirming the average flow."
FAQ
Q. Which moving average period should I use? A. There's no single right answer. Short (5, 20), medium (50, 75), and long (200) are all common, but which fits your symbols and timeframes is something to settle by comparing several periods on the same data. Start with one or two, get a feel for their behavior through backtesting, then add from there.
Q. Will I win if I just buy the golden cross? A. A crossover is only the past fact that two MAs swapped positions — it guarantees nothing. When there's no trend, price reverses right after the cross constantly (a whipsaw). If you use crossovers, make them a rule together with a trend check and a stop, and verify the behavior through backtesting.
Q. How do moving averages relate to buying the dip? A. "Targeting where price pulls back to the MA and bounces in a trend" is both an MA setup and buying the dip / selling the rally. Use the MA as your gauge for how deep to wait, and the two connect naturally. Both articles cover entering at a favorable price in the direction of the trend.
Q. Should I write the strategy-rule field discretionary or rules-based? A. Either works. If defining the situation in words is easier for you to reproduce, go discretionary; if you'd rather lock conditions to numbers, go rules-based. Writing both is fine too. What matters is that you can reproduce the same decision later.
Q. Which markets can I practice moving averages on? A. ENTRIQ's backtesting supports US stocks, FX, commodities, and crypto. Japanese stocks are planned for a future release. You can also view multiple timeframes at once, which helps when you confirm the higher-timeframe MA slope while hunting entries on a lower timeframe.
The moving average is the most familiar indicator there is, but whether you can profit from it comes down to telling whether there's a trend and to a stop that accounts for whipsaws. Write how you use it and your exit into the strategy-rule field as a pair, and test them on past charts again and again.
ENTRIQ is a chart replay and backtesting platform for individual traders, combining chart replay, trade journaling, and AI analysis.
This article does not guarantee the effectiveness or profitability of any strategy or rule. The figures and examples shown are samples to illustrate how to write rules, not indications of investment results. You are solely responsible for your own investment decisions.
Reproduce this validation yourself
With ENTRIQ's chart replay, you can trade through past charts using the same rules.
Start 14-day free trialValidate your method on past charts
The same validation in this article can be reproduced with your own method. On past charts, do the classics really work?
- ✓ Replay past charts
- ✓ AI feedback on your trades
- ✓ Validate methods with statistics