Breakout Trading Strategy|Spot Fakeouts, Backtest Your Rules
Learn to define your breakout entries and exits, tell real breaks from fakeouts, and backtest the rules on past charts. Includes two sample rule entries.
You jump in the moment price clears the top of the range, and it immediately rolls back over and stops you out. If you've traded breakouts, you've probably been there. Breakouts get a reputation for being easy to spot but hard to actually profit from. Most of the time, the reason is the same: you enter without a clear way to separate a real break from a fakeout, and without deciding where you'll get out if you're wrong.
This article is a deep dive on breakouts, one of the setups listed in 8 Core Trading Strategies Explained. We'll cover how to define entries and exits together, the common ways traders confirm a real break, and how to write the whole thing into ENTRIQ's strategy-rule field (with two sample entries). This isn't about predicting where price goes. It's about putting your rules into words so you can test them on past charts, over and over.
What a breakout is
A breakout is when price clears a level that had been holding it back — a horizontal line, the top or bottom of a range, a recent high or low, a trendline — and you trade in the direction of the break. Going long on an upside break is the common case, but shorting a downside break works on the same logic.
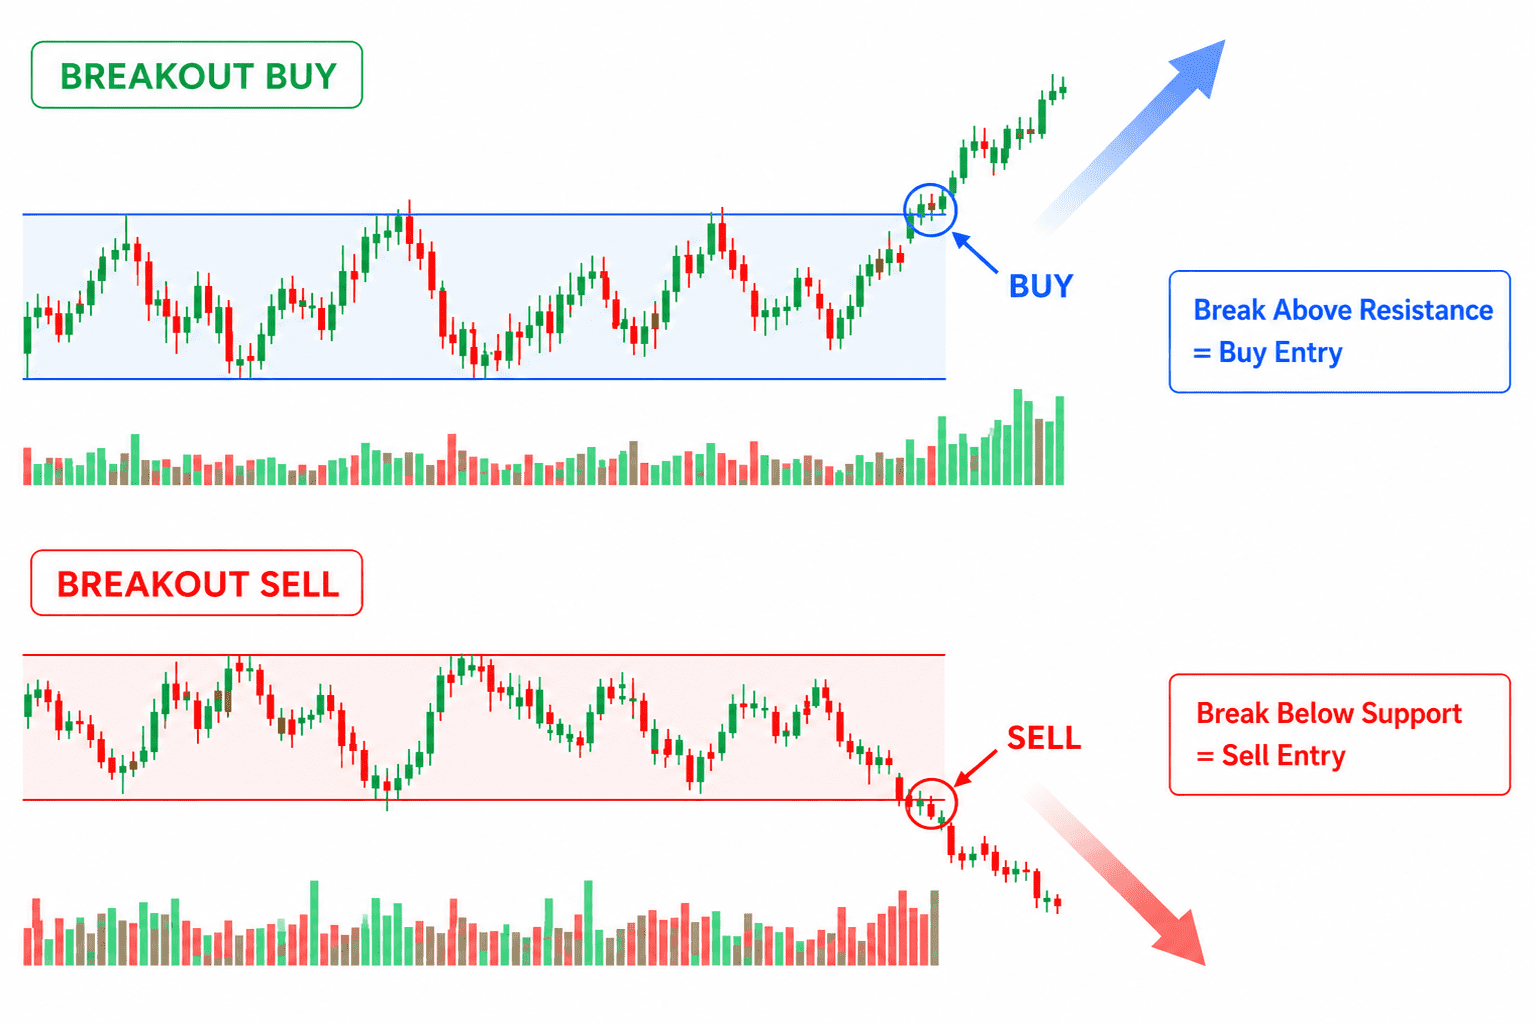
Breakouts draw attention because price can move quickly in one direction right after a level gives way. When a line that both buyers and sellers were watching breaks, traders on the wrong side of the move begin exiting positions, and that chain of exits can add fuel to the move.
The hard part of breakouts comes down to one word: the fakeout. Price looks like it has cleared the level, then snaps back inside, leaving everyone who chased it stranded. This happens constantly. That's why, with breakouts, it isn't enough to say "I'll buy the break." You need to decide in advance what counts as a real break, and where you'll admit you were wrong.
Breakouts are often thought of as "jump in the second it breaks." In practice, the part that actually needs rules is what you do after the break — how you confirm it, and where you exit if it fails.
Why backtest it
There's no single right way to tell a real breakout from a fakeout. Some traders confirm on the close. Others wait for volume, or for price to come back and retest the level. Which approach fits the symbols and timeframes you trade isn't something you can settle by arguing about it. The only way to answer it is through repeated testing.
The problem is that real breakouts don't show up every day. If you wait for a level to form and then break, testing a single approach can take weeks of screen time.
This is where chart replay (backtesting) earns its place. You rewind a past chart and step through it one bar at a time, deciding "would I enter here?" without seeing what comes next. You're using virtual funds, so there's no real loss, and you can pull up break setups again and again. You can even run "confirm on the close" against "enter on the wick" over the exact same data and compare.
Common ways traders confirm a real break
How traders confirm a breakout varies. Rather than calling any one method correct, here are the common ones, laid out neutrally. Which you adopt is something to verify with your own backtest data.
| What to look at | The idea | Watch out for |
|---|---|---|
| Close beyond the level | Require a bar to close outside the level, not just wick through it | Waiting for the close means a later entry |
| Strength of the break | A larger candle body on the break suggests more conviction | A very large bar often means chasing the high |
| Retest | Wait for price to pull back to the level and hold before entering | You can miss breaks that just run without pulling back |
| Volume | Use rising volume on the break as a secondary signal | Volume patterns vary by symbol and session |
| Strength of the level | A line that's been tested many times means more when it breaks | The stronger the level, the more fakeouts it can produce |
Let's look at each a little more concretely.
Close beyond the level
The most common confirmation is waiting for the close. While a bar is still forming, price often pokes through a level for a moment and then slips back inside before the bar finishes. Count those wick-only breaks (a quick poke and pull-back) as real and you'll keep grabbing fakeouts. Requiring "the bar closed outside the level" (a close beyond it) filters out those momentary wicks.
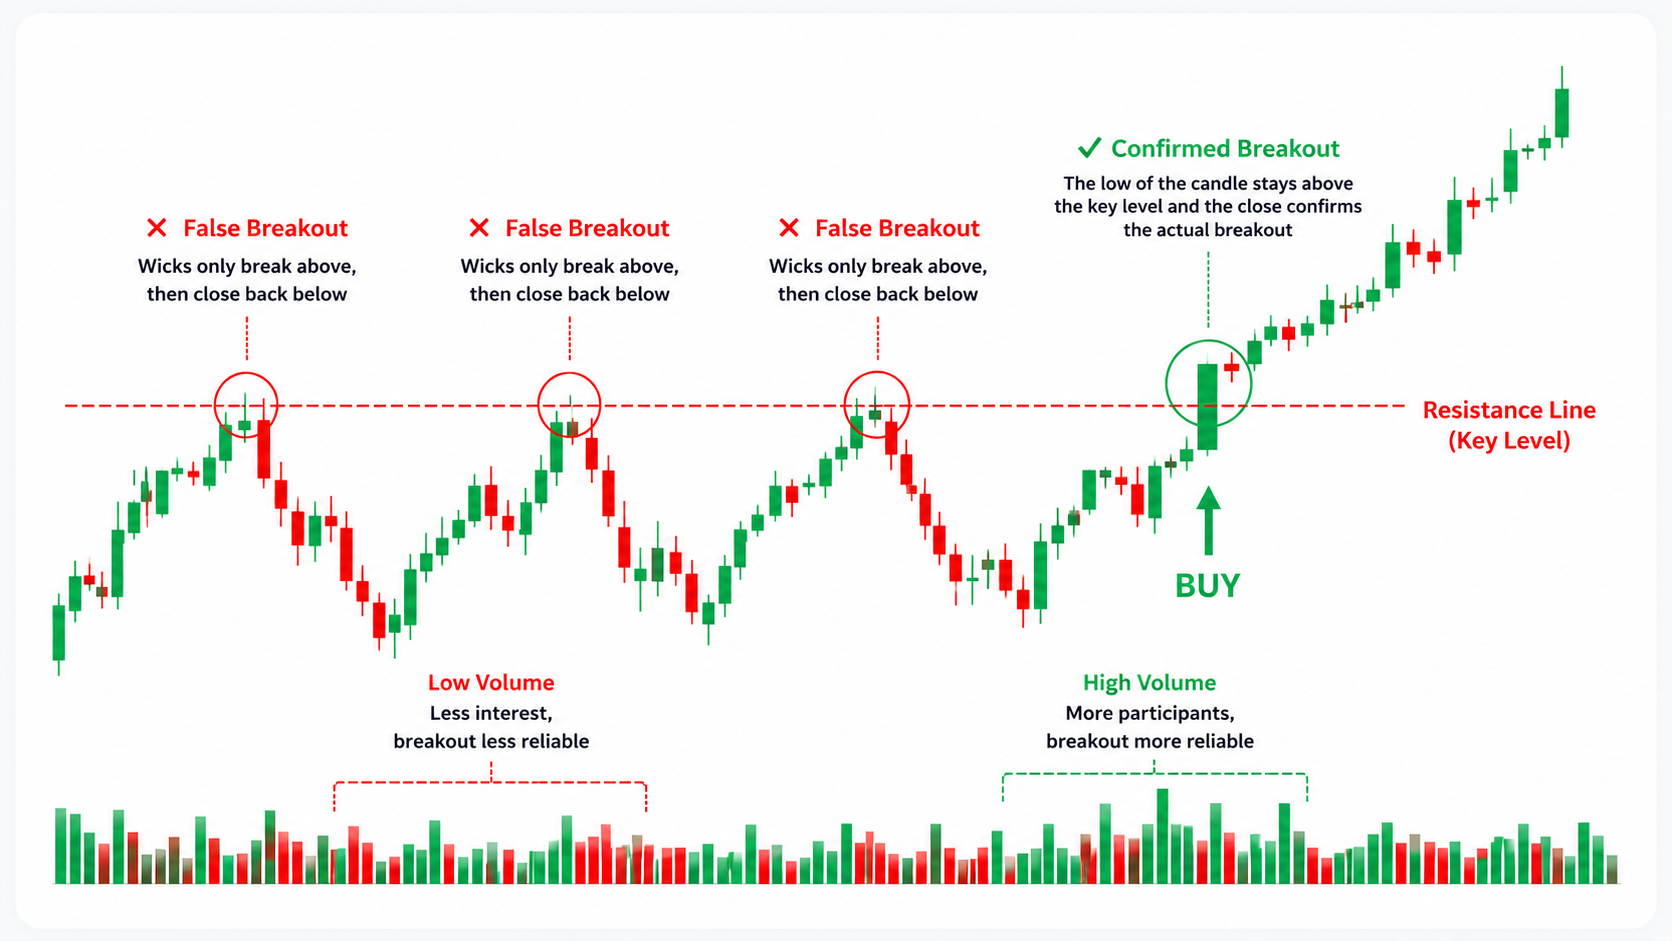
The catch is that waiting for the close delays your entry. On a daily chart you wait until the session close; on a 4-hour chart, four hours — and if price runs in the meantime, your entry sits further from the level and your stop distance widens. There's a tradeoff: you raise accuracy at the cost of a worse entry. Whether close confirmation pays off on your symbols and timeframes is worth checking in backtesting.
Strength of the break
This reads the body of the breaking bar (the distance from open to close) — the larger it is, the more conviction behind the break. A big bullish candle clearing the level in one go suggests stronger buying than price grinding through on a small body, and it's read as less likely to fail. Paired with volume backing, it becomes a way to gauge how real the momentum is.
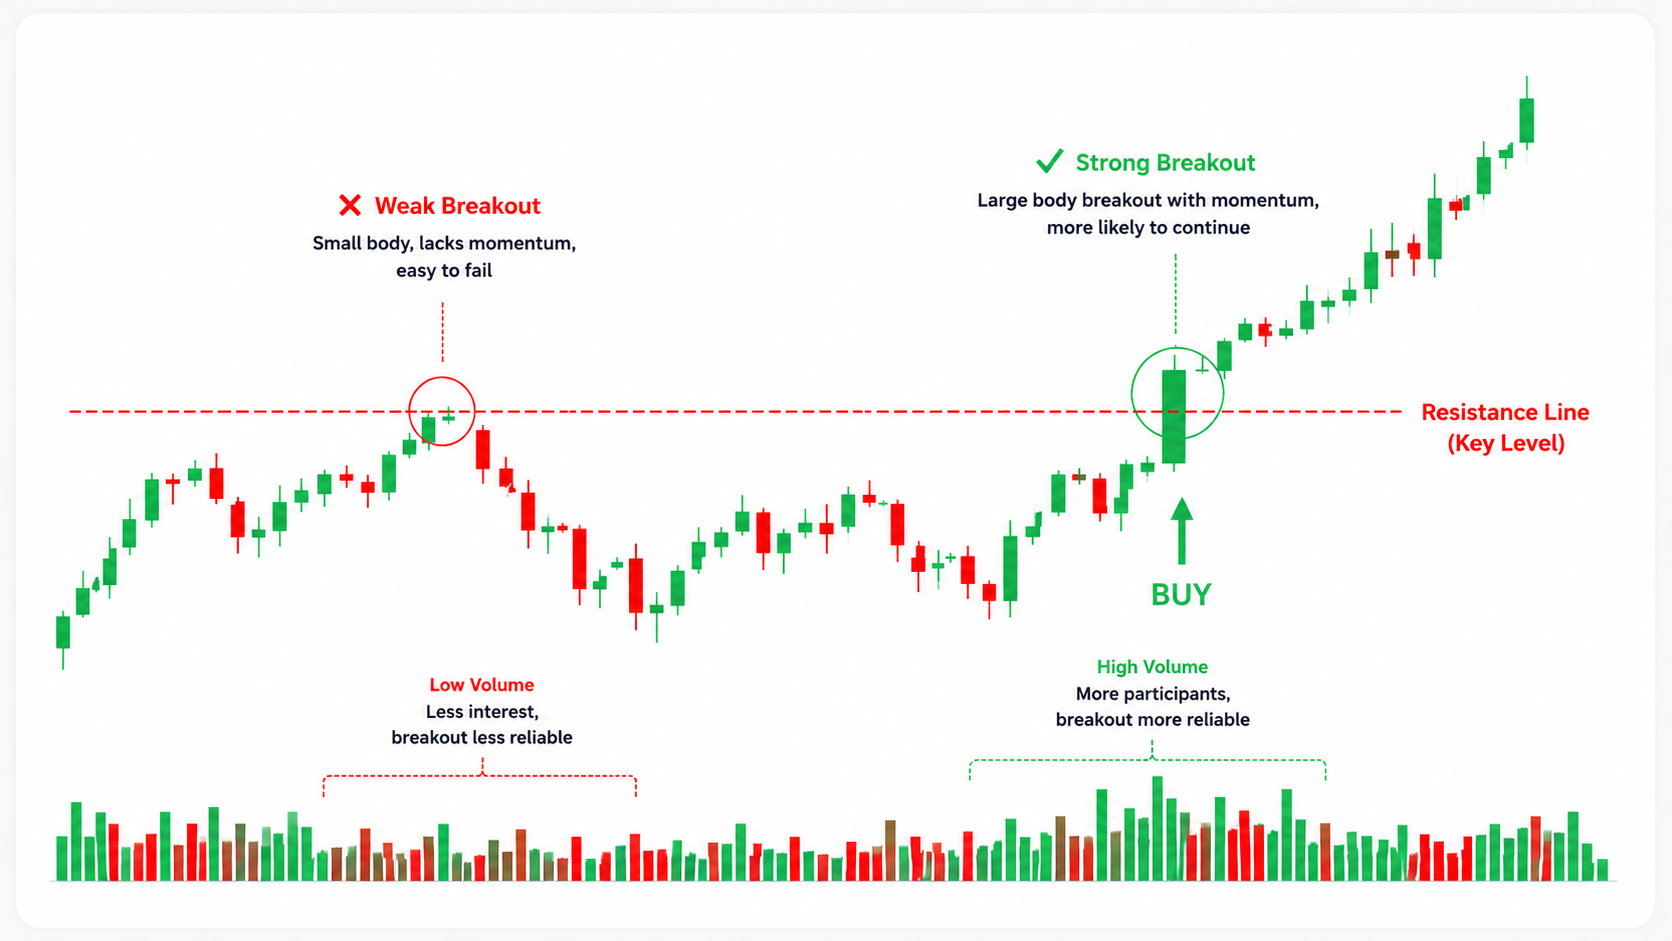
But a very large bar calls for the opposite caution. Jump on a bar that's already run far and you're chasing the high, and a snap-back right after often stops you out. If you trade off strength, your entry location and stop distance change a lot depending on whether you enter on the breaking bar itself or wait for a pullback on the next bar. This too is something to settle in backtesting — how you enter a strong break.
Retest
Here you wait, after the break, for price to pull back to the level and hold (the line that was resistance flipping to support) before entering. Because you confirm the broken line now acts as support on the way up, it filters out fakeouts well, and you can place your stop just below the retested level — which keeps your stop distance small. Those are its advantages.
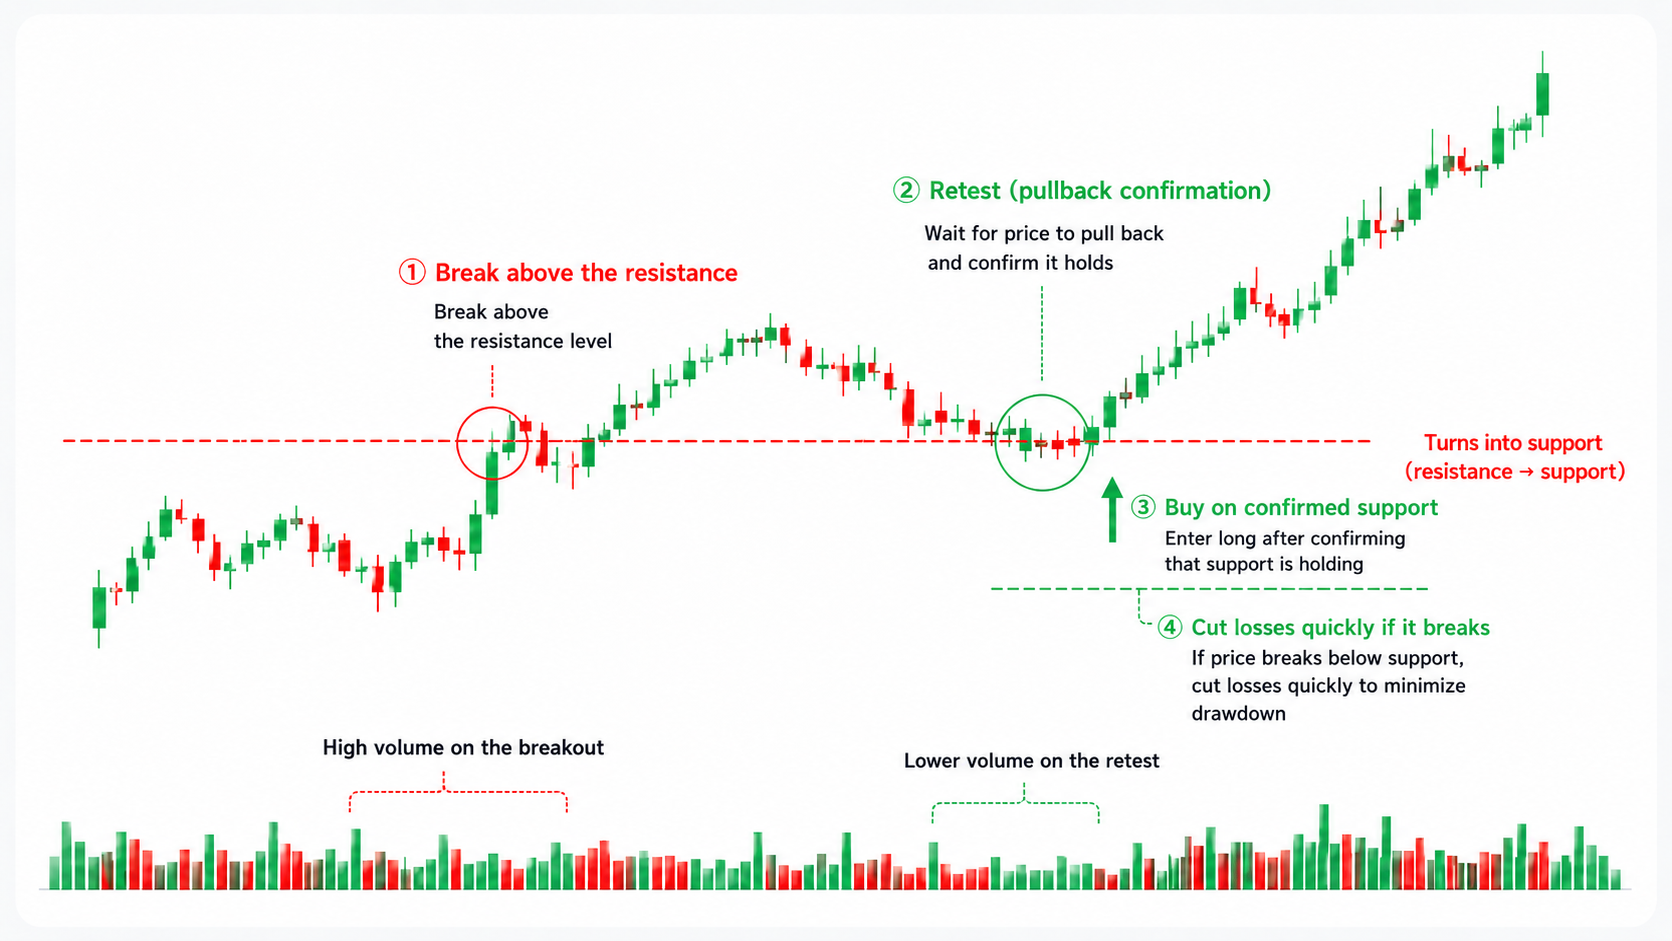
The catch is that waiting for a retest means missing breaks that just run without pulling back. The strongest breaks often run one direction without offering a pullback, and waiting for a retest racks up "never got in." Whether you make a retest mandatory, or enter on the breaking bar when momentum is strong — that distinction is also something you firm up as your own rule through backtesting.
Volume
This uses whether volume (trading activity) rises on the break as a secondary confirmation. If a level that many participants watch breaks on rising volume, you read the break as having momentum behind it. If it breaks on thin volume instead, that's a sign interest is weak and the break is more likely to fizzle into a fakeout.
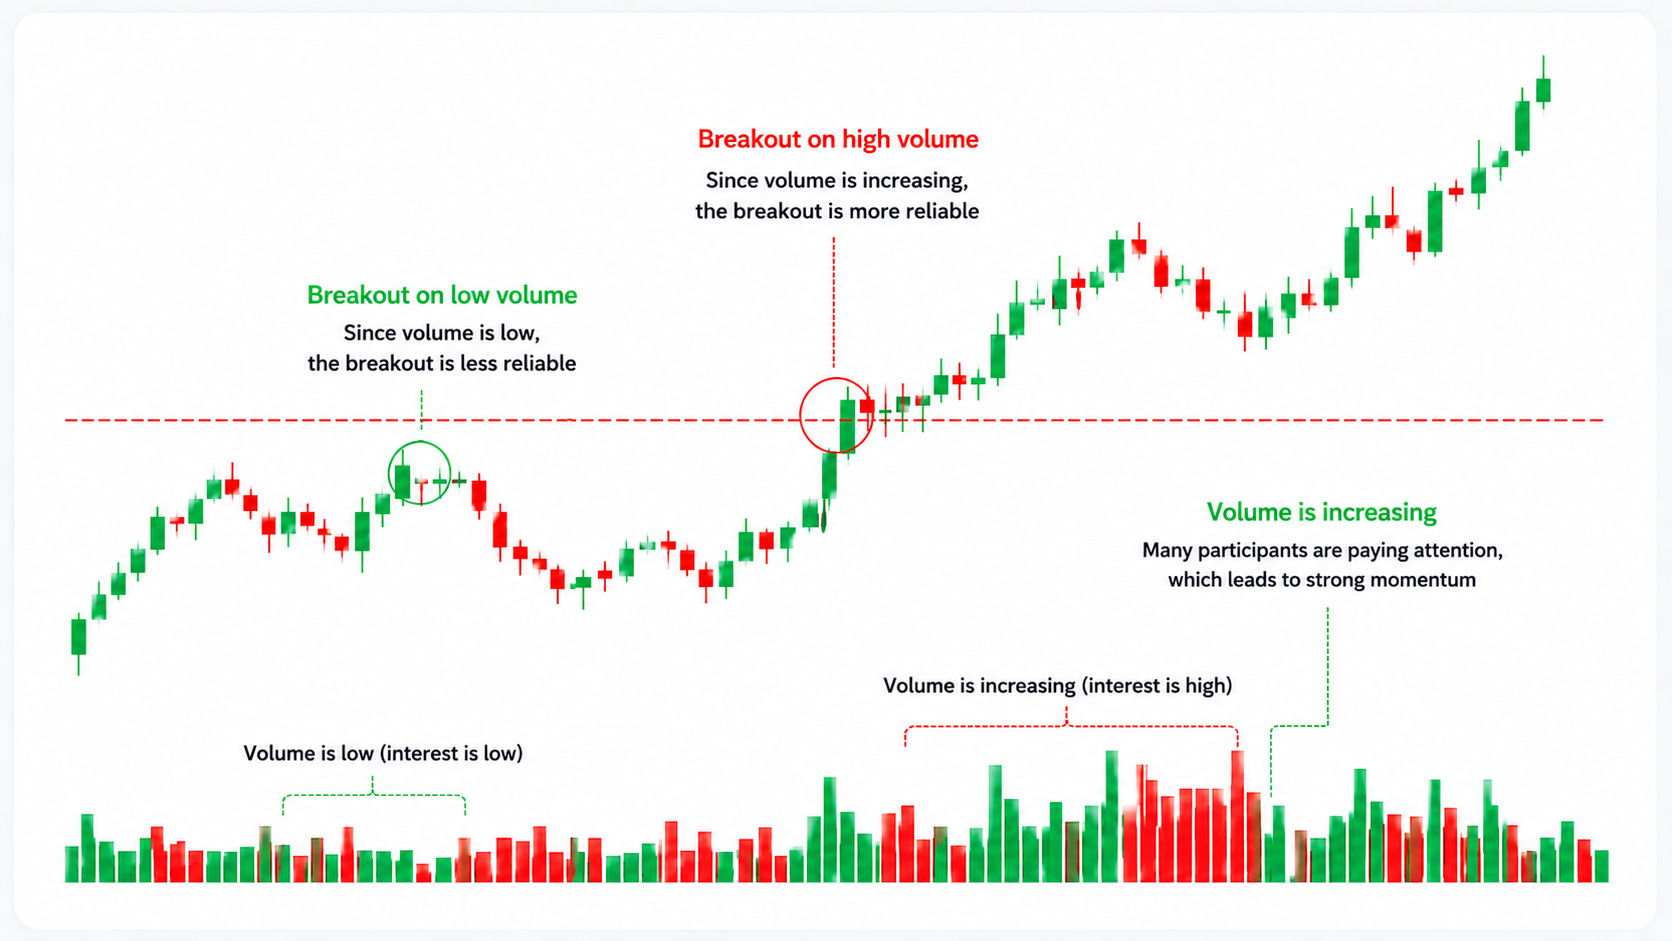
The catch is that volume patterns vary by symbol and session. On low-liquidity symbols, or in quiet hours, volume itself is unstable, and "did it rise or fall" gets hard to judge. Rather than leaning on volume alone, it's safer to use it as a supporting indicator that reinforces the read — combined with close confirmation or the size of the body.
Strength of the level
The idea is that the more times a line has bounced or capped price in the past, the more a break of it means. When a strong level that many participants watch gives way, the exits from those positioned the other way chain more readily, and the move in the break's direction tends to be larger. You judge which levels are "strong" by counting how many times that line has held on the past chart.
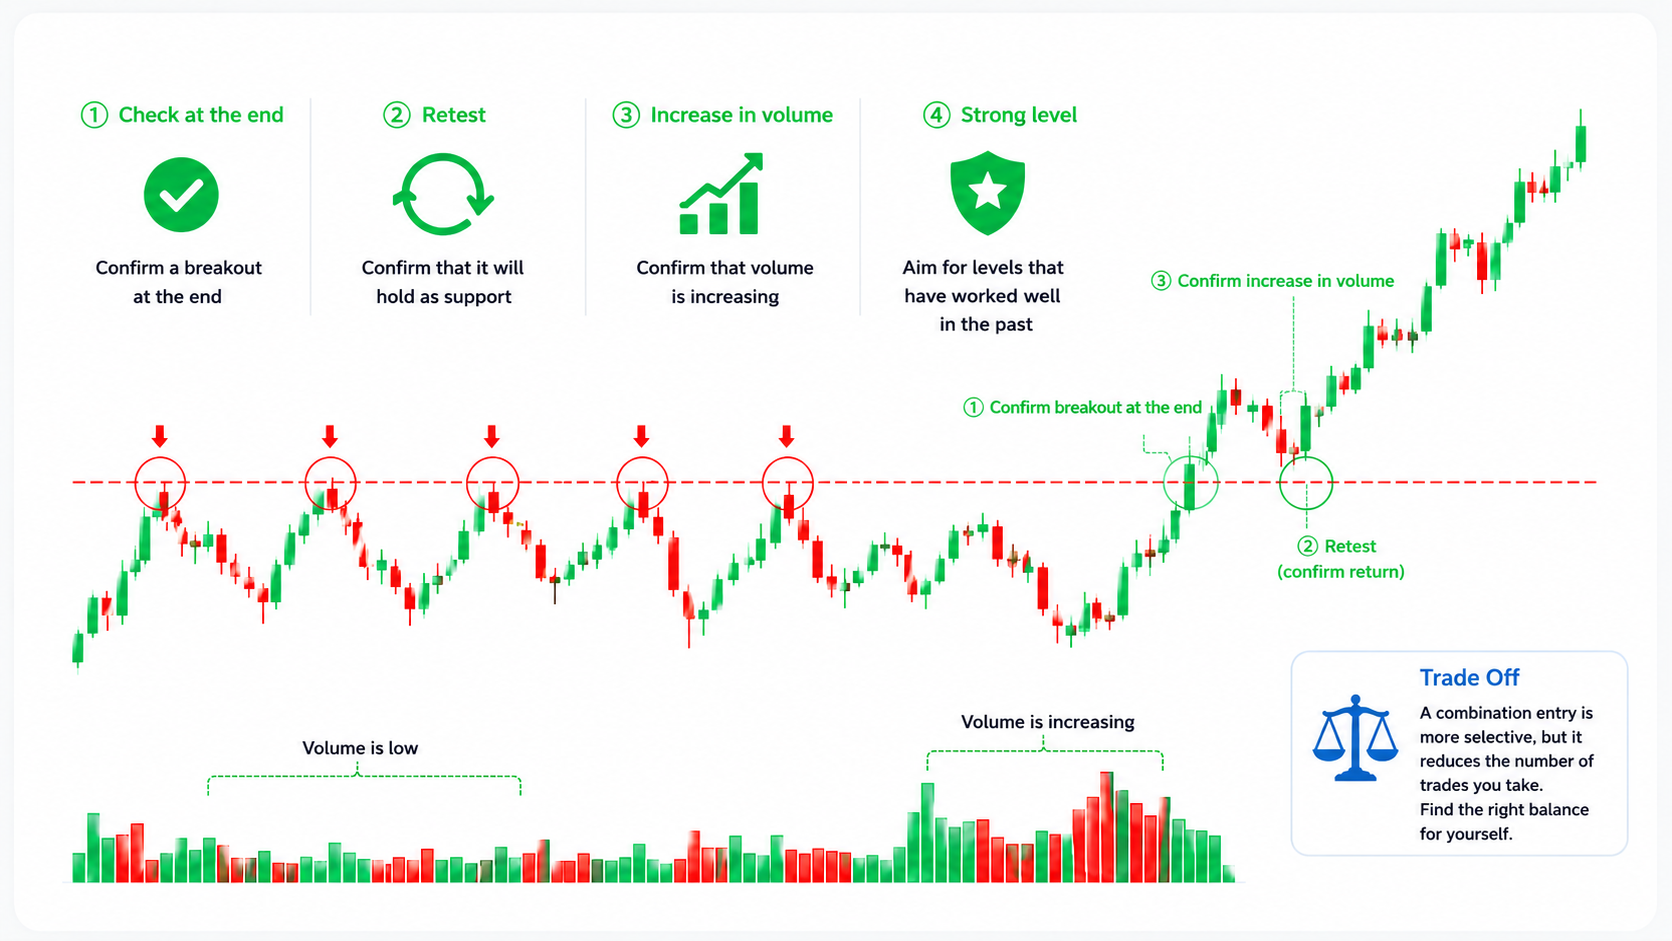
The catch is that the stronger the level, the more fakeouts it can produce. The fact that many people watch it means profit-taking and counter-trend orders cluster just ahead of it, making it easier for price to look like it broke and then reverse. The stronger the level you target, the more it pays to stack other checks — close confirmation, a retest — to filter the fakeouts out.
The key point: these aren't mutually exclusive. Traders commonly combine them — "confirm on the close and wait for a retest." The more conditions you stack, the more selective your entries become, and the fewer trades you get. Where you sit on that tradeoff is also something to test.
For a deeper dive into telling real breaks from fakeouts, see How to Spot a False Breakout (Fakeout) and Backtest It, which works through how much confirmation to require before you call a break real.
Define entries and exits together
The most common mistake with breakouts is setting an entry condition and skipping the exit. When you hit a fakeout with no line in the sand, the loss just keeps growing. Always put entries and exits into words as a pair.
Entry (when you get in)
- Which level you're trading (recent high / range top / a weekly level)
- What counts as "broken" (a confirmed close / a strong body through the level)
- Whether you wait for a retest or enter on the break
Exit (when you get out)
- Stop: the price that tells you it was a fakeout (price closes back inside the level / breaks the recent low)
- Target: where you take profit (the next level / a fixed distance / scale out part and let the rest run)
If you tie your stop to the level — "if price closes back inside the line, it was a fakeout" — the decision to get out is less driven by emotion. When the reason you entered breaks, you exit. Setting up that pairing first is the core of building a breakout rule.
Sample strategy-rule entries (two patterns)
ENTRIQ's strategy tags include a strategy-rule field where you write down your own rules. Putting your breakout rules into words there lets you check, after every backtest, whether you actually entered the way you planned. There are two broad ways to write them. Neither is better — pick whichever lets you reproduce your decisions more reliably.
Pattern A: Discretionary (define the situation in words)
The discretionary style. You define context, entry, stop, exit, and skip conditions in words, without locking them to numbers.
Context: A clear range, or a consolidation within an uptrend. Don't trade upside breaks at the bounce-high of a downtrend. Entry: Buy when price closes clearly above the range top. Skip wick-only breaks. Stop: If price closes back inside the broken range top, call it a fakeout and exit. Exit: Consider taking profit at the next level above. If momentum continues, scale out part and let the rest run. Skip: Don't enter right before major data releases, or when volume is extremely thin.
Pattern B: Rules-based (spell the conditions out in numbers)
The rules-based style. You fix the decision with indicators and numbers, so anyone reading it reaches the same conclusion.
Trigger: Treat a break of the highest high of the last 20 bars as a breakout (a 20-bar breakout). Entry: Close confirmed above the 20-bar high. Stop: Exit if price breaks below the low of the entry bar (or −2%). Target: Take half off at +6%, hold the rest until price breaks the recent low. Filter: The day's volume must be above its recent average.
Numbers make your review quantitative and easier to aggregate in a backtest. But the figures here — 20 bars, −2%, +6% — are only examples of how to write a rule. They don't guarantee any edge or profit. Backtest them on your own symbols and timeframes, and adjust as the data tells you.
Test it, then record it
Once your rules are in words, pull up past charts, find break setups, and run virtual entries and exits without seeing the future. After each one, log whether you entered by the rule and how you handled any fakeout in your trade journal and strategy tags.
One strategy tag per trade. Tag it something like "Breakout – close confirmed," and you can later pull up just those trades to see win rate, P&L, average risk-reward, and so on across the whole setup.
A caution here: don't take the numbers at face value while your sample is small. Judging a rule on 5 or 10 trades is far too early. Build up enough repetitions in risk-free backtesting first, then look at the pattern.
The chart above shows how the data might look when you test different confirmation methods (it's sample data, not real results). Same breakout, different confirmation rule, different numbers — seeing that difference for yourself is the whole point of backtesting.
You can also review what you've logged with AI analysis. AI analysis isn't a trade signal or a recommendation — it identifies and describes patterns from your past trade data and notes. It can surface things you'd miss on your own, like "the trades I stopped out of on fakeouts often have 'too early' in the notes."
Four common mistakes
- Chasing every break the instant it happens. With no rule to confirm real versus fake, you stop out on every fakeout. Decide how you'll confirm before you enter.
- Entering with no stop. Fakeouts come with the territory. If your exit isn't tied to the level, a failed break can run your loss wide.
- Testing a different situation every time. Mixing range breaks, new highs, and weekly levels together makes it impossible to know what you actually tested. Narrow to one setup and build up the repetitions.
- Only remembering the breaks that worked. The one that ran sticks in memory, but the fakeouts you stopped out of are the ones worth reviewing. Log the losses under the same strategy tag.
FAQ
Q. Are breakouts too hard for beginners? A. The idea — ride the move once a level breaks — is easy to grasp. The hard parts are telling real from fake and setting your stop. If you decide your confirmation method and stop up front, the way this article lays out, and build up repetitions through backtesting, beginners can absolutely develop it into their own rule.
Q. Is there a way to avoid fakeouts entirely? A. No. Confirming on the close or waiting for a retest can reduce how often you get caught, but the more you reduce it, the later your entries and the fewer your trades. Rather than trying to avoid fakeouts, it's more realistic to decide in advance where you exit when one hits.
Q. Confirm on the close, or enter the instant it breaks — which is better? A. Neither is universally better. Closing confirmation raises accuracy but delays the entry; entering on the break is faster but catches more fakeouts. The reliable way to know which fits your symbols and timeframes is to backtest both on the same data and compare.
Q. Should I write the strategy-rule field discretionary or rules-based? A. Either works. If defining the situation in words is easier for you to reproduce, go discretionary; if you'd rather lock conditions to numbers, go rules-based. Writing both is fine too. What matters is that you can reproduce the same decision later.
Q. Which markets can I practice breakouts on? A. ENTRIQ's backtesting supports US stocks, FX, commodities, and crypto. Japanese stocks are planned for a future release. You can also view multiple timeframes at once, which helps when you're practicing breakouts off higher-timeframe levels.
Put "ride the break" into words and it sounds simple, but whether you can profit from it comes down to telling real from fake and to your stop. Write your confirmation method and exit into the strategy-rule field as a pair, and test them on past charts again and again.
ENTRIQ is a chart replay and backtesting platform for individual traders, combining chart replay, trade journaling, and AI analysis.
This article does not guarantee the effectiveness or profitability of any strategy or rule. The figures and examples shown are samples to illustrate how to write rules, not indications of investment results. You are solely responsible for your own investment decisions.
Reproduce this validation yourself
With ENTRIQ's chart replay, you can trade through past charts using the same rules.
Start 14-day free trialValidate your method on past charts
The same validation in this article can be reproduced with your own method. On past charts, do the classics really work?
- ✓ Replay past charts
- ✓ AI feedback on your trades
- ✓ Validate methods with statistics