Support and Resistance Explained|Draw Levels and Backtest
How to draw support and resistance, judge a level's strength, and read role reversal. Includes backtesting and two sample strategy-rule templates.
The level you drew to bounce off gets cleared in a breath and stops you out. Or a resistance you'd written off as "it won't break again" rejects price over and over. If you've ever watched support and resistance, this probably sounds familiar. Support and resistance levels underpin almost every setup, but when which price you treat as support or resistance and how strong that level is are left vague, you end up fading levels that don't hold, or shrugging off strong ones and jumping in.
This article is a deep dive on support and resistance, one of the setups listed in 8 Core Trading Strategies Explained. We'll cover what acts as support and resistance, how to judge the strength of a level, role reversal (the swap of roles after a break), and how to write it into ENTRIQ's strategy-rule field (with two sample entries). This isn't about predicting where price goes. It's about putting your rules into words so you can test them on past charts, over and over.
What support and resistance are
Support is a price area where, as price falls, it's repeatedly held and bounces; resistance is an area where, as price rises, it's repeatedly capped and turns back. When many participants watch a price as "it might bounce / get capped here," orders actually cluster there, and it functions as support or resistance.
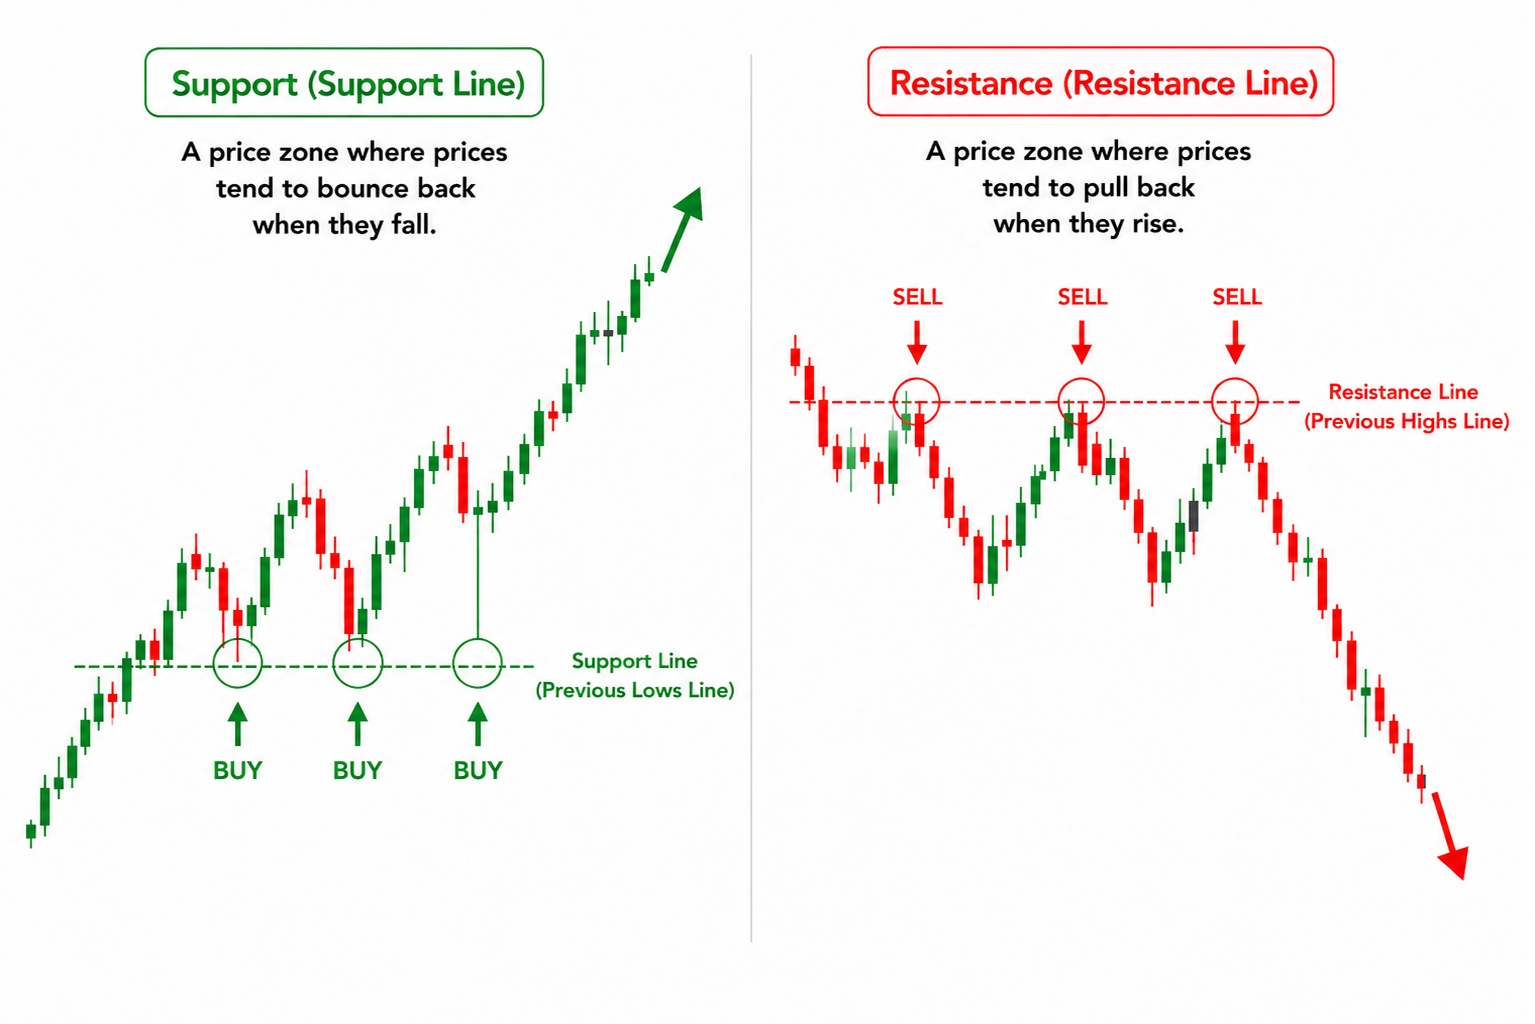
Support and resistance matter because almost every setup is built on the concept. A breakout starts from price clearing a resistance; buying the dip targets a bounce off support; range trading takes the round trip between the ceiling (resistance) and floor (support). In other words, how you draw support and resistance is the foundation under all of these setups.
The hard part of support and resistance is that "a level isn't a single right answer." On the same chart, which price you read as support or resistance varies by person. What matters isn't hunting for "a level that always holds" — it's deciding "what kind of level I treat as support or resistance," and knowing, through backtesting, how well that level has worked in the past.
What acts as support and resistance
The prices participants treat as support and resistance come in a few kinds. Rather than calling any one correct, here are the common ones, laid out neutrally. Which you build around is something to verify with your own backtest data.
| Kind | The idea | Watch out for |
|---|---|---|
| Prior swing highs / lows | Treat a zone that capped or held price many times before as resistance / support | A high or low from too long ago may not be watched anymore |
| Horizontal level | Draw a horizontal line at a price that bounced several times in the same zone | There's latitude in what you treat as "the same" price |
| Moving average | Read whether price bounces at an MA as a moving support / resistance | Which MA works varies by symbol and timeframe |
| Round number | Treat psychological prices (100, 1000, key rates) as levels | They don't always react |
| Number of touches / strength | The more times a level held or capped, the stronger it is | The stronger the level, the bigger the move when it breaks |
Let's look at each a little more concretely.
Prior swing highs / lows
The most basic support and resistance are the highs and lows that stopped price many times in the past. A high that's been rejected before tends to be watched as resistance when price climbs back to it; a low that's held before tends to be watched as support when price drops back. Because they're prices actually printed on the chart, the reason is easy to grasp, and the more participants are looking at the same high or low, the better it tends to work.
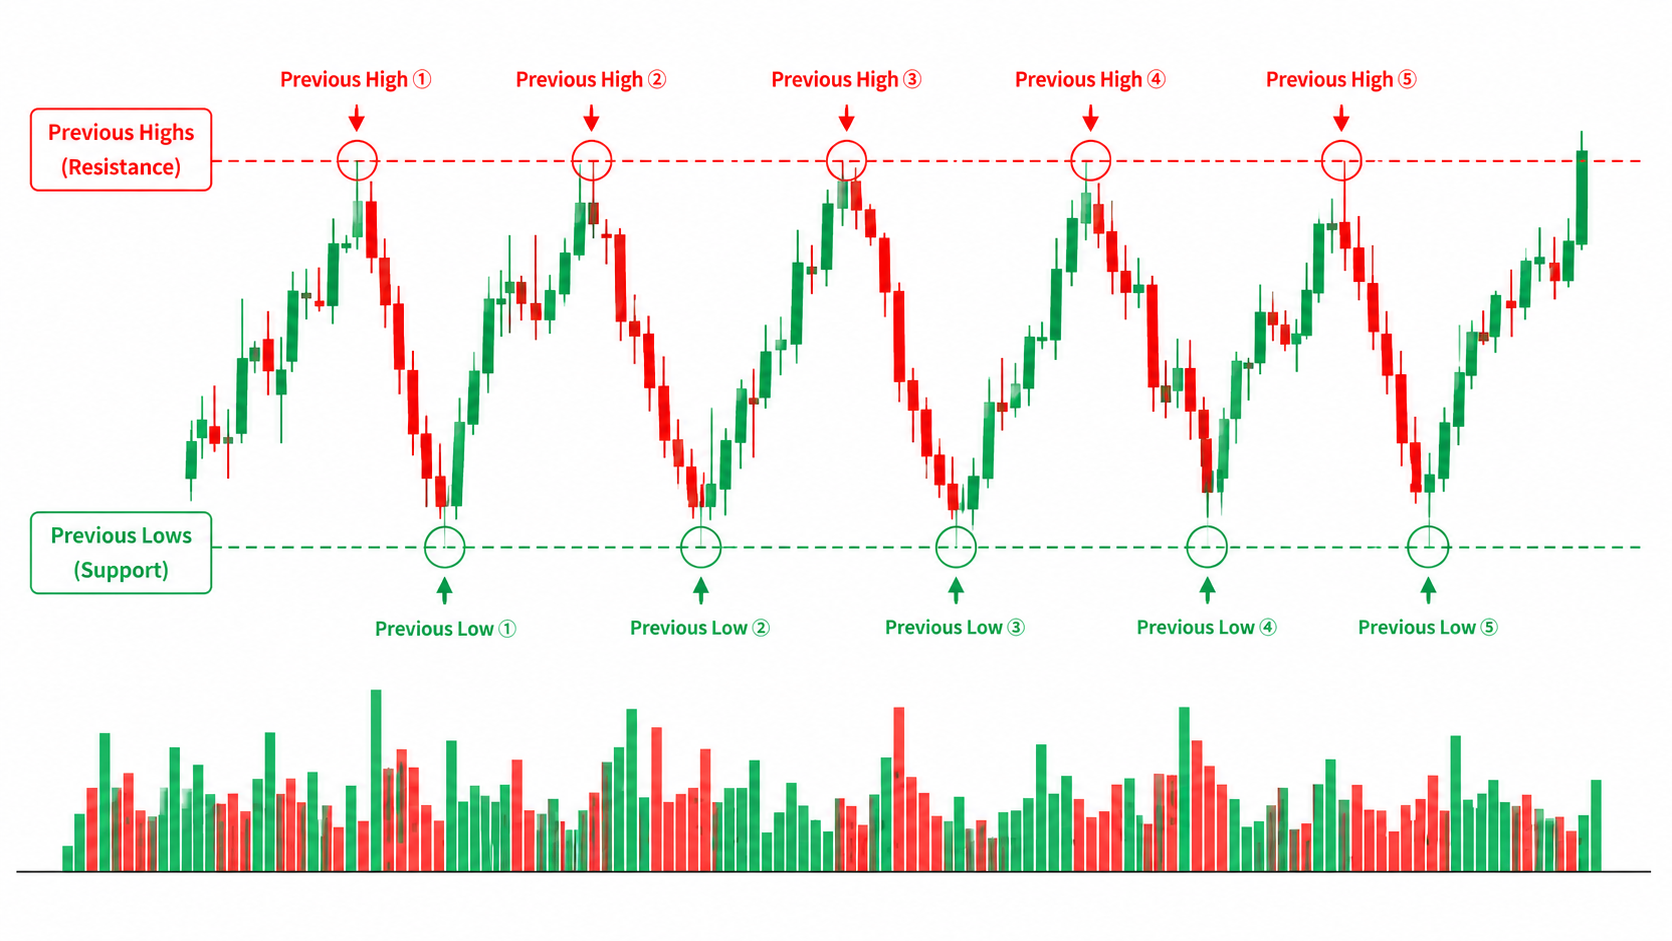
The catch is that a high or low from too long ago gets watched less. The more recently a high or low has been working, the stronger it is as live support or resistance; a high from years back, with fewer participants remembering it, can become less relevant over time. If you use prior swings, decide for yourself "how much weight I give to recent ones," and confirm in backtesting that the standard fits your symbol and timeframe.
Horizontal level
This draws a horizontal line through a price that bounced or rejected several times in the same zone. If a high or low is a "point," a horizontal level connects them and reads them as a "line" — useful for catching the ceiling and floor of a range, or the level of a consolidation. The more highs and lows sit at nearly the same price, the stronger that horizontal level is watched.
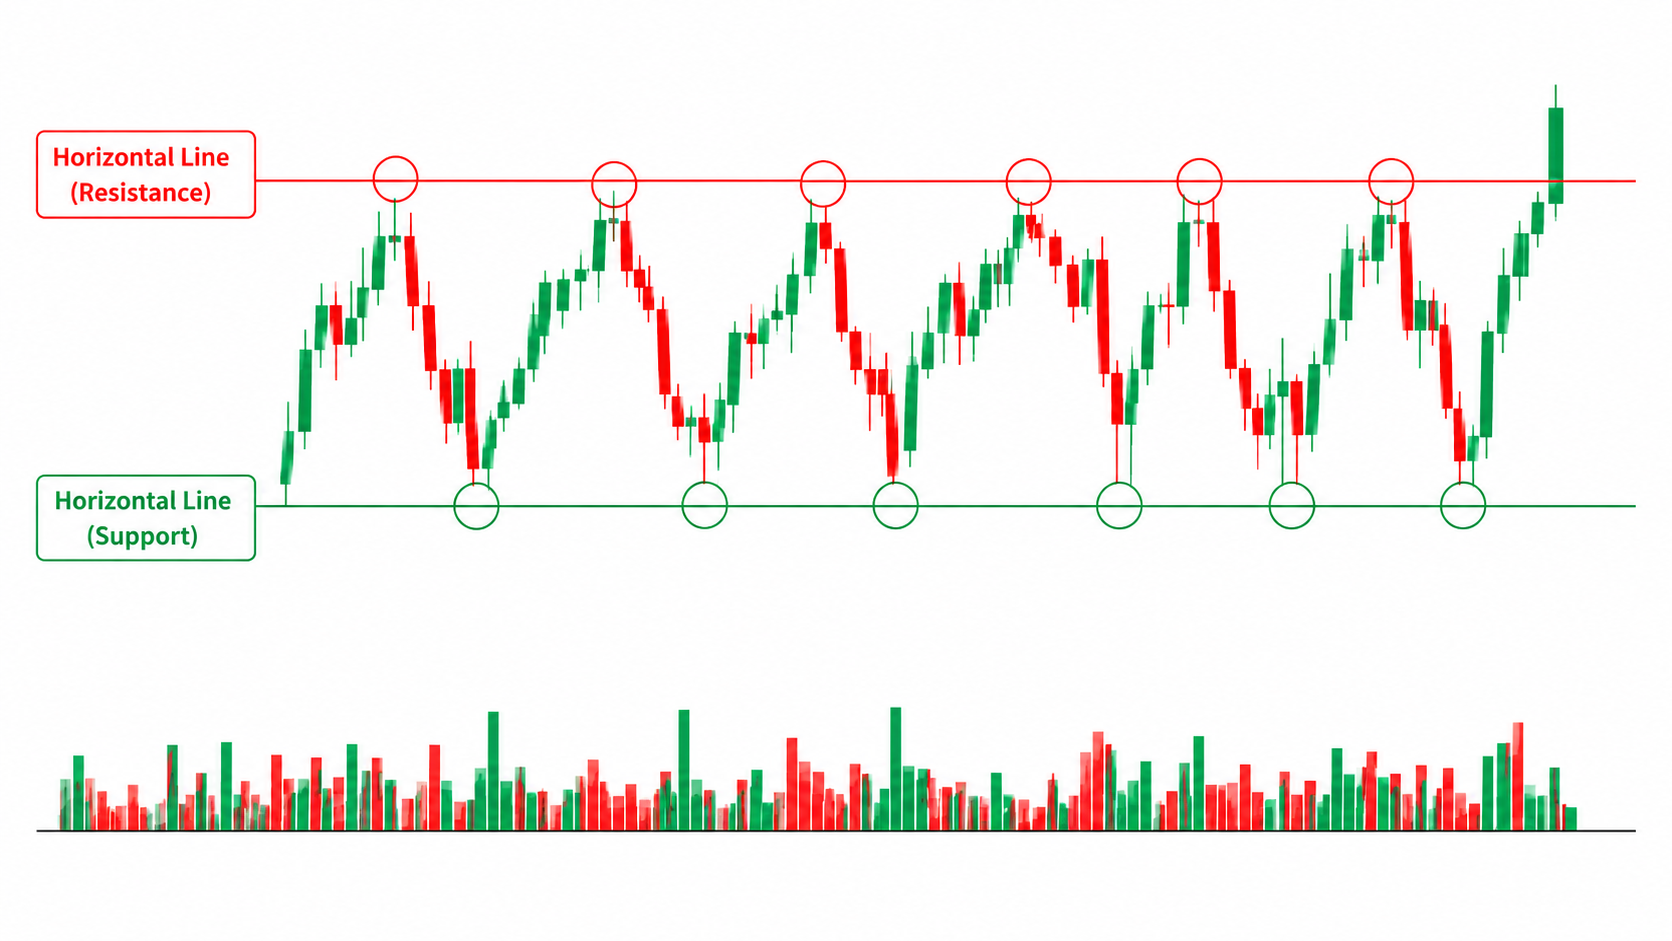
The catch is that there's latitude in what you treat as "the same" price. Price rarely bounces at exactly the same value; in practice it bounces across a slightly shifting zone. Whether you read that as one line or as a "zone" with some width changes how you judge whether it held. If you use horizontal levels, deciding "how much shift I still count as the same line" cuts down on wavering judgment.
Moving average
Beyond horizontal lines, this uses a moving average (MA) as a "moving support / resistance." In an uptrend, a pattern of price dropping to the 20-day or 50-day MA and bouncing can repeat, and there the MA is acting like a support line. Unlike a horizontal level, it moves with the trend, so it's used as a guide for pullbacks in a trending market.
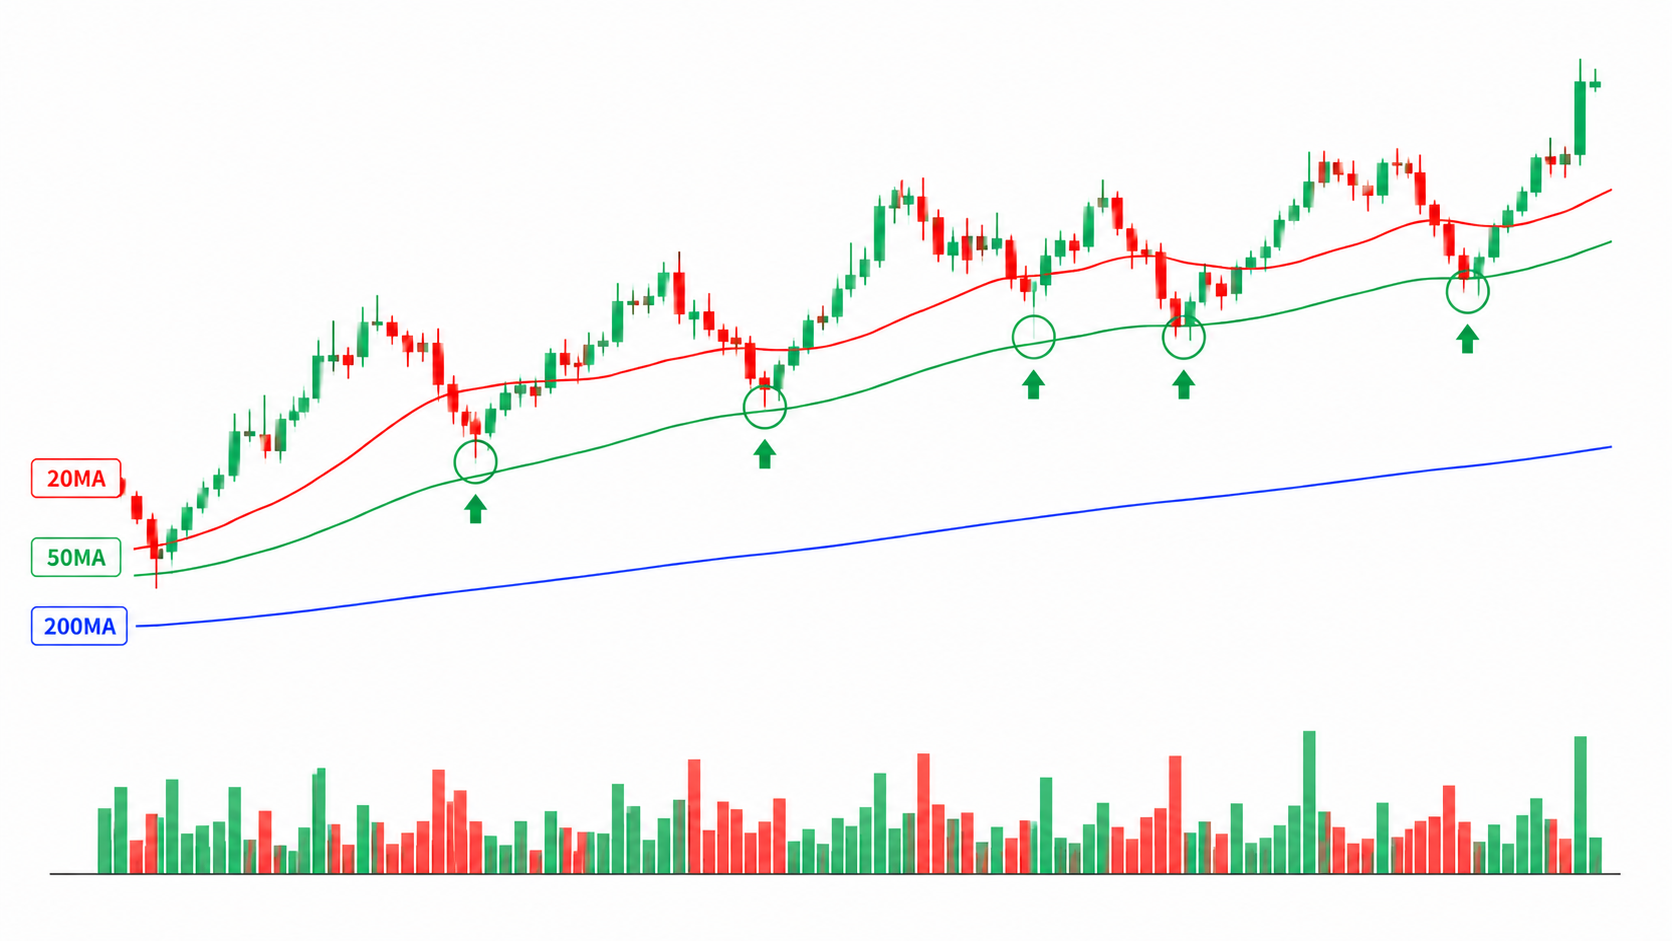
The catch is that which MA works varies by symbol and timeframe. Using an MA as support / resistance has enough to dig into — slope, the bounce, how to pick the period — that it's covered as a full article in How to Use Moving Averages. If you use an MA as a kind of support and resistance, read that one alongside this.
Round number
This reads round prices — 100, 500, 1000, or key FX rates — as psychological support and resistance. Because many participants watch the same price as a milestone ("if it clears / breaks 1000"), orders tend to cluster there, and bounces or caps are said to happen more easily. What stands out is that the price itself is watched, regardless of the chart's shape.
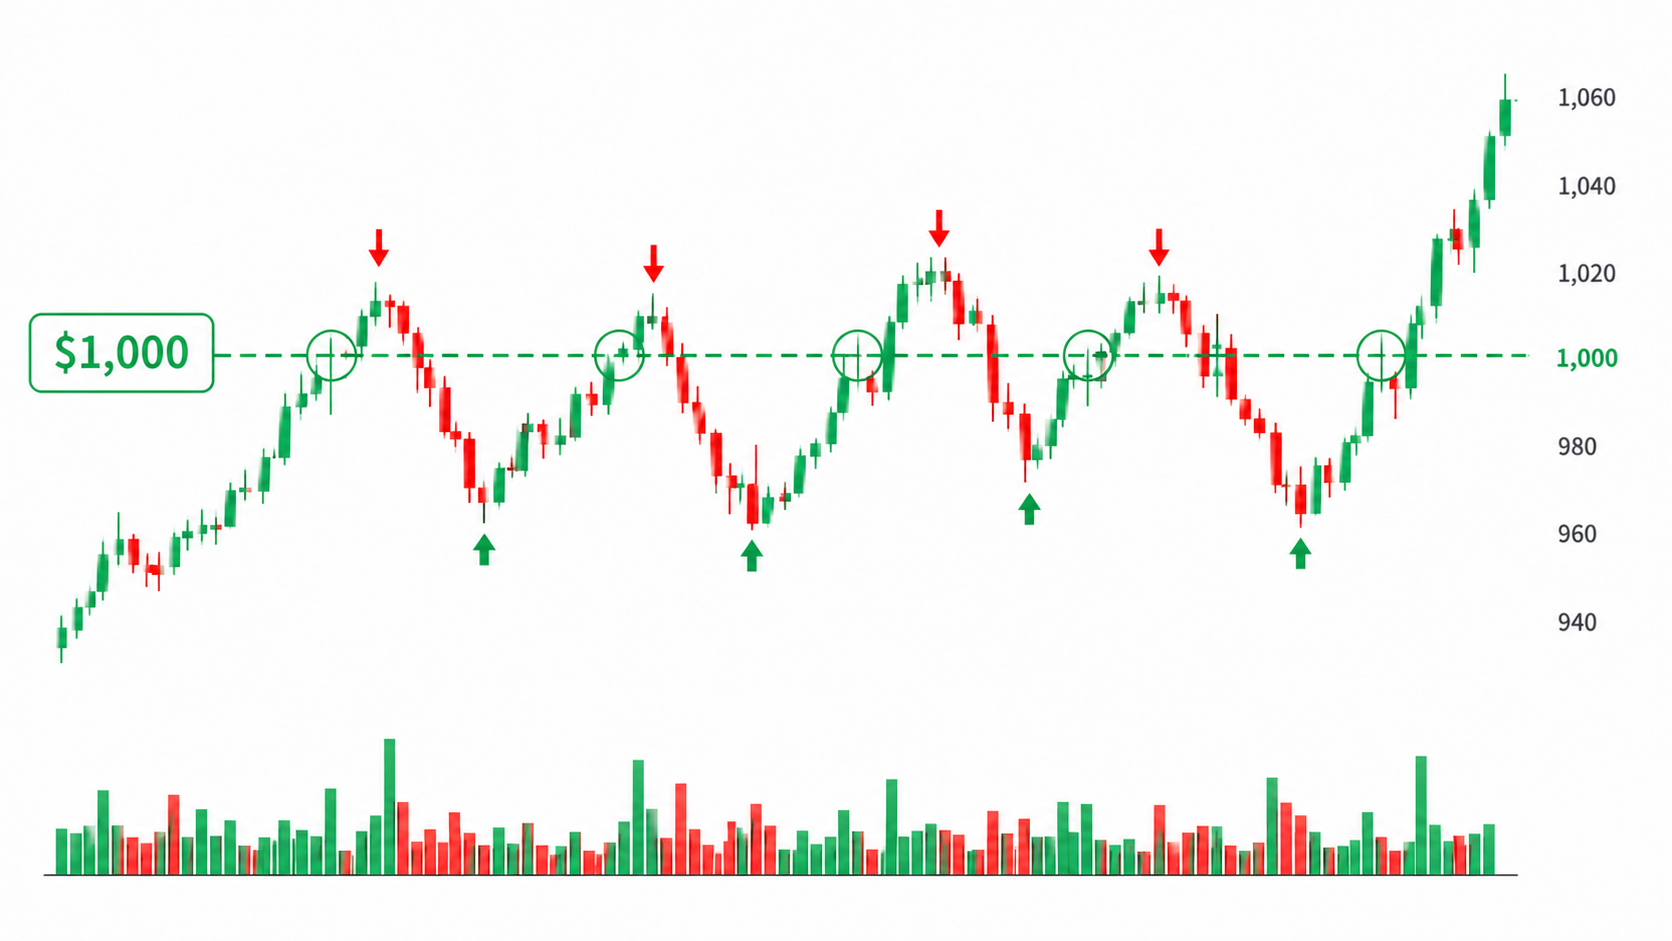
The catch is that they don't always react. A round number is only "easier to watch" — a trend with momentum can blow straight through it without a glance. If you use round numbers, rather than leaning on one alone, weight prices where a round number overlaps a prior swing or a horizontal level, and it works more reliably.
Number of touches / strength
The same support or resistance varies in "strength" by how many times it's been rejected. A level that's bounced only once or twice is weaker than one held (or capped) three, four times, which is watched by more participants as strong support or resistance. Beyond just drawing a line, you measure its strength by counting how many times it's worked in the past.
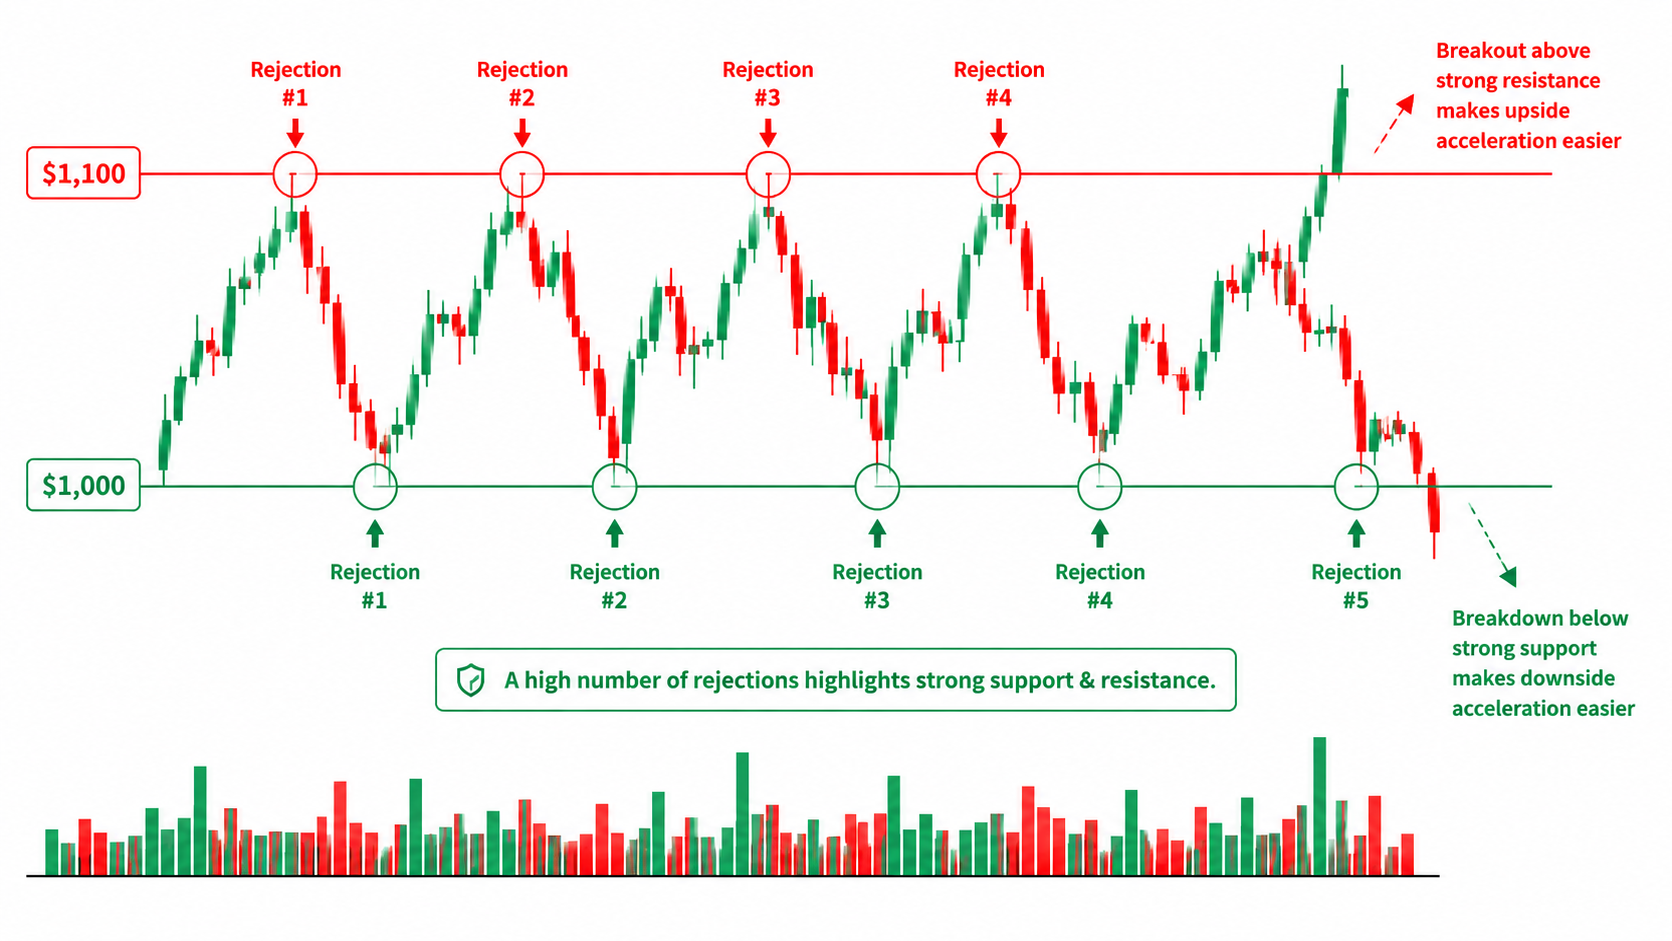
The catch is that the stronger the level, the bigger the move when it breaks. When a strong support or resistance that's been watched many times gives way, the exits from those positioned the other way chain, and price can move sharply in the break's direction (a breakout). So a "strong level" is both a place to trade a bounce and a place where momentum appears once it breaks. When you measure strength, it pays to view it both ways — as a place to trade a bounce, and as a place to prepare for a break.
The key point: these aren't mutually exclusive. The more reasons overlap at one price — "a prior low, a round number, and the 50-day MA all sitting at the same zone" — the more it tends to function as strong support or resistance. Hunting for where reasons overlap is the shortcut to finding levels that work.
Role reversal
What you can't skip in understanding support and resistance is role reversal. When price clears a resistance, that level then acts as support — the roles of resistance and support swap. Conversely, when price breaks a support, that level turns into resistance.
Why do the roles swap? After price clears a resistance and comes back to that price once, traders who previously sold at that level may begin treating it as support and buy it back, and those who missed the break look to get in there and buy. As a result, the former resistance acts as support. This "come back once after the break and hold" move is the basis for the retest in buying the dip and for entries after a breakout.
Knowing role reversal lets you see, not "the break is the end," but "after the break, does the level work in the opposite role?" Buying a stock that's cleared a resistance, where it comes back to that resistance and holds, is an application common to many setups.
Why backtest it
There's no single right answer to "which level you draw" or "how strong you read it." On the same chart, someone weighting recent highs and someone weighting round numbers will draw different levels. Which way of drawing fits the symbols and timeframes you trade isn't something you settle by arguing. The only way to answer it is through repeated testing.
This is where chart replay (backtesting) earns its place. You rewind a past chart, draw your own support and resistance, then step through it one bar at a time to confirm "does it actually bounce here?" without seeing what comes next. You're using virtual funds, so there's no real loss, and you can test "how well the levels I drew worked in the past" over and over. Your eye for drawing levels sharpens the more repetitions you run.
Define entries and exits together
When you use support and resistance too, most mistakes come from setting an entry condition and skipping the exit. Always put entries and exits into words as a pair.
Entry (when you get in)
- Which level you treat as support / resistance (prior swings / a horizontal level / an MA / overlapping reasons)
- Where at the level you enter (on reaching it, or waiting for a bounce bar)
- How you confirm the level's strength (how many times it's bounced)
Exit (when you get out)
- Stop: the price that admits the level didn't hold (a clear close beyond it)
- Target: where you take profit (the next support / resistance / a fixed distance / scale out part and let the rest run)
If you tie your stop to the level — "if price closes below the support I leaned on, that support didn't hold, so I'm out" — the decision to exit is less driven by emotion. When the reason you entered (the bounce at the level) breaks, you exit. Setting up that pairing first is the core of building a rule around support and resistance.
Sample strategy-rule entries (two patterns)
ENTRIQ's strategy tags include a strategy-rule field where you write down your own rules. Putting how you use support and resistance into words there lets you check, after every backtest, whether you actually entered the way you planned. There are two broad ways to write them. Neither is better — pick whichever lets you reproduce your decisions more reliably.
Pattern A: Discretionary (define the situation in words)
The discretionary style. You define context, entry, stop, exit, and skip conditions in words, without locking them to numbers.
Context: There's a clear support that's bounced several times before, and price has dropped near it. Skip when the level has only worked once or twice. Entry: Buy when price drops near the support and prints a bounce bar. Stop: If price closes clearly below the support I leaned on, call it not-holding and exit. Exit: Consider taking profit at the next resistance above. If role reversal turns it into support, let the hold run. Skip: Don't enter on a weak level with only one reason, or right before major data releases.
Pattern B: Rules-based (spell the conditions out in numbers)
The rules-based style. You fix the decision with indicators and numbers, so anyone reading it reaches the same conclusion.
Context: Treat a horizontal zone that bounced 3+ times within the last N bars as support. Entry: Buy when price drops to within (a set distance) of the support and the day closes back above it. Stop: Exit if the close drops below the support (or support −2%). Target: Take profit on reaching the next resistance − (a set distance). Filter: The support must have bounced at least N times in the past.
Numbers make your review quantitative and easier to aggregate in a backtest. But the figures here — number of touches, −2% — are only examples of how to write a rule. They don't guarantee any edge or profit. Backtest them on your own symbols and timeframes, and adjust as the data tells you.
Test it, then record it
Once your rules are in words, pull up past charts, find spots where support and resistance get tested, and run virtual entries and exits without seeing the future. After each one, log whether you entered by the rule and whether the level held or broke in your trade journal and strategy tags.
One strategy tag per trade. Tag it something like "Support bounce," and you can later pull up just those trades to see win rate, P&L, average risk-reward, and so on across the whole setup.
A caution here: don't take the numbers at face value while your sample is small. Judging a rule on 5 or 10 trades is far too early. Build up enough repetitions in risk-free backtesting first, then look at the pattern.
The chart above shows how the data might look when you test by level strength (it's sample data, not real results). Same support and resistance, different strength or overlapping reasons, different numbers — seeing that difference for yourself is the whole point of backtesting.
You can also review what you've logged with AI analysis. AI analysis isn't a trade signal or a recommendation — it identifies and describes patterns from your past trade data and notes. It can surface things you'd miss on your own, like "the trades I entered on a level with only one reason stopped out more often."
Four common mistakes
- Fading a weak level. Decide a level that's worked only once or twice is strong support or resistance, and it gets cleared and stops you out. Narrow to levels that have worked many times, or where several reasons overlap.
- Entering with no stop on the level. Support and resistance break sometimes. If your exit isn't tied to the level, a level that doesn't hold runs your loss wide.
- Pinning a level to exactly one line. Price doesn't bounce at exactly the same value. Without reading it as a zone with some width, you misjudge "it didn't hold" on a tiny shift.
- Missing role reversal after a break. Think "the break is the end" and you miss the spot where the broken level works in the opposite role. Watch the move back to the level after a break too.
FAQ
Q. How do I draw support and resistance levels? A. There's no single right answer. The basics are connecting highs and lows that bounced or rejected many times, and drawing a horizontal level through a zone where several highs and lows line up. What matters most is not pinning it to exactly one line but reading it as a zone with some width, and treating levels that have worked many times as stronger. How well a level you drew has worked in the past is best confirmed by backtesting.
Q. What is role reversal? A. When price clears a resistance, that level then acts as support; when price breaks a support, it turns into resistance — a swap of roles. It shows up as the move where, after a break, price comes back to the price once and holds (or gets capped), and it's the basis for the retest in buying the dip and entries after a breakout.
Q. Are support and resistance different from a trendline? A. Both are "lines where price tends to stop," but they run differently. Support and resistance usually refer to horizontal price zones (sideways lines), while a trendline is drawn on a slant to show the slope of the market. In trend following you use a trendline; in ranges and pullbacks you use horizontal support and resistance — you switch by the situation.
Q. Should I write the strategy-rule field discretionary or rules-based? A. Either works. If defining the situation in words is easier for you to reproduce, go discretionary; if you'd rather lock conditions to numbers, go rules-based. Writing both is fine too. What matters is that you can reproduce the same decision later.
Q. Which markets can I backtest support and resistance on? A. ENTRIQ's backtesting supports US stocks, FX, commodities, and crypto. Japanese stocks are planned for a future release. You can also view multiple timeframes at once, which helps when you confirm the higher-timeframe levels while fading a bounce on a lower one.
Support and resistance sound simple put as "a level where price bounces," but whether you can profit from them comes down to pinning the level and judging its strength, and to your stop when it doesn't hold. Write how you draw levels and your exit into the strategy-rule field as a pair, and test them on past charts again and again.
ENTRIQ is a chart replay and backtesting platform for individual traders, combining chart replay, trade journaling, and AI analysis.
This article does not guarantee the effectiveness or profitability of any strategy or rule. The figures and examples shown are samples to illustrate how to write rules, not indications of investment results. You are solely responsible for your own investment decisions.
Reproduce this validation yourself
With ENTRIQ's chart replay, you can trade through past charts using the same rules.
Start 14-day free trialValidate your method on past charts
The same validation in this article can be reproduced with your own method. On past charts, do the classics really work?
- ✓ Replay past charts
- ✓ AI feedback on your trades
- ✓ Validate methods with statistics