Chart Patterns Explained|Read the Shapes and Backtest Them
How to read double tops, triangles, and head and shoulders neutrally. Covers false breakouts, backtesting, and two sample rules you can test yourself.
You spot a "clean double top," enter, and price reverses without ever breaking the neckline. Or a triangle "breaks out," only to snap straight back — a false breakout. If you've ever watched chart patterns, this probably sounds familiar. Chart patterns read entry and exit cues from the "shape" price action draws, but when which shapes you treat as valid and the condition for calling a pattern complete are left vague, you end up jumping on unfinished shapes or getting caught by false breakouts.
This article is a deep dive on chart patterns, one of the setups listed in 8 Core Trading Strategies Explained. We'll cover how to read the classic shapes, how to wait for a pattern to complete, how to deal with false breakouts (failed patterns), and how to write it into ENTRIQ's strategy-rule field (with two sample entries). This isn't about predicting where price goes. It's about putting your rules into words so you can test them on past charts, over and over.
What chart patterns are
A chart pattern reads a specific "shape" formed by a cluster of candles and tries to gauge the next move from it. A "double top" rejected twice at the same high, a "triangle" whose range narrows steadily — shapes that have recurred over the years each carry a name. The idea behind it: because many participants watch the same shape, orders tend to cluster once the shape completes and price clears a level.
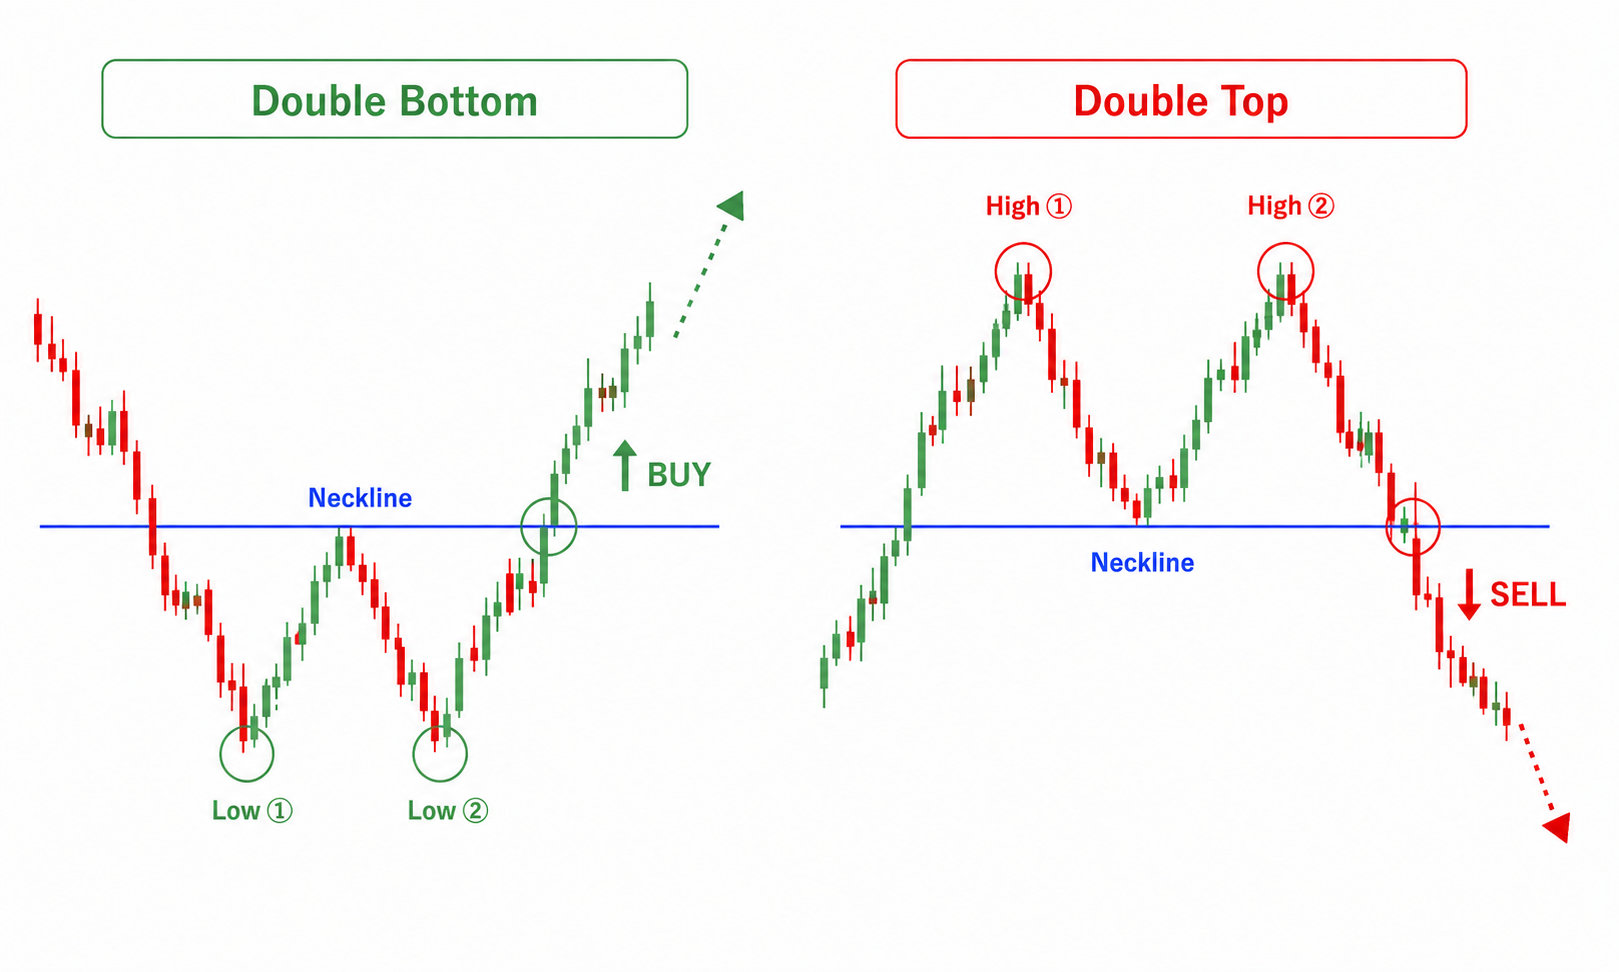
Chart patterns are easier to grasp as an application of support and resistance and breakouts. Most patterns are built from the support and resistance lines that several highs and lows create, and clearing that line (a neckline, or the side of a triangle) is the starting point for entry. In other words, the ability to draw the lines and judge the break is the foundation under using patterns.
The hard part of chart patterns is that "the shape is obvious in hindsight, but in real time you can't tell whether it's complete." Rewind the chart and it's a "clean double top," but in the moment the second peak might still take out the high. What matters isn't hunting for "the perfect shape" — it's deciding "which shapes I treat as valid, and how I judge them complete," and knowing, through backtesting, how well that judgment has worked in the past.
The classic chart patterns
There are many chart patterns; here are the common ones, laid out neutrally. Which you build around is something to verify with your own backtest data.
| Pattern | Shape | Watch out for |
|---|---|---|
| Double top / bottom | Two peaks (troughs) rejected at the same area. A reversal cue | Only complete once the neckline breaks; before that, unfinished |
| Head and shoulders | Three peaks, the middle highest. A classic reversal | The two shoulders often aren't level |
| Triangle | Highs and lows narrow, the range converging | Which way it breaks isn't knowable in advance |
| Flag / pennant | A pause after a strong move. A continuation cue | You have to judge "pause" versus "reversal" |
| Cup with handle | A rounded bottom and a small later pullback. Continuation | A large shape that takes time to complete |
Let's look at each a little more concretely.
Double top / double bottom
The most basic reversal pattern is the double top (double bottom). A double top is rejected twice at nearly the same high and completes when price breaks below the trough between them (the neckline) — a cue for a reversal from up to down. A double bottom is the reverse: held twice at the same low, completing on a break above the peak between them. The reasoning: being stopped twice at the same price shows the strength of support or resistance at that area.
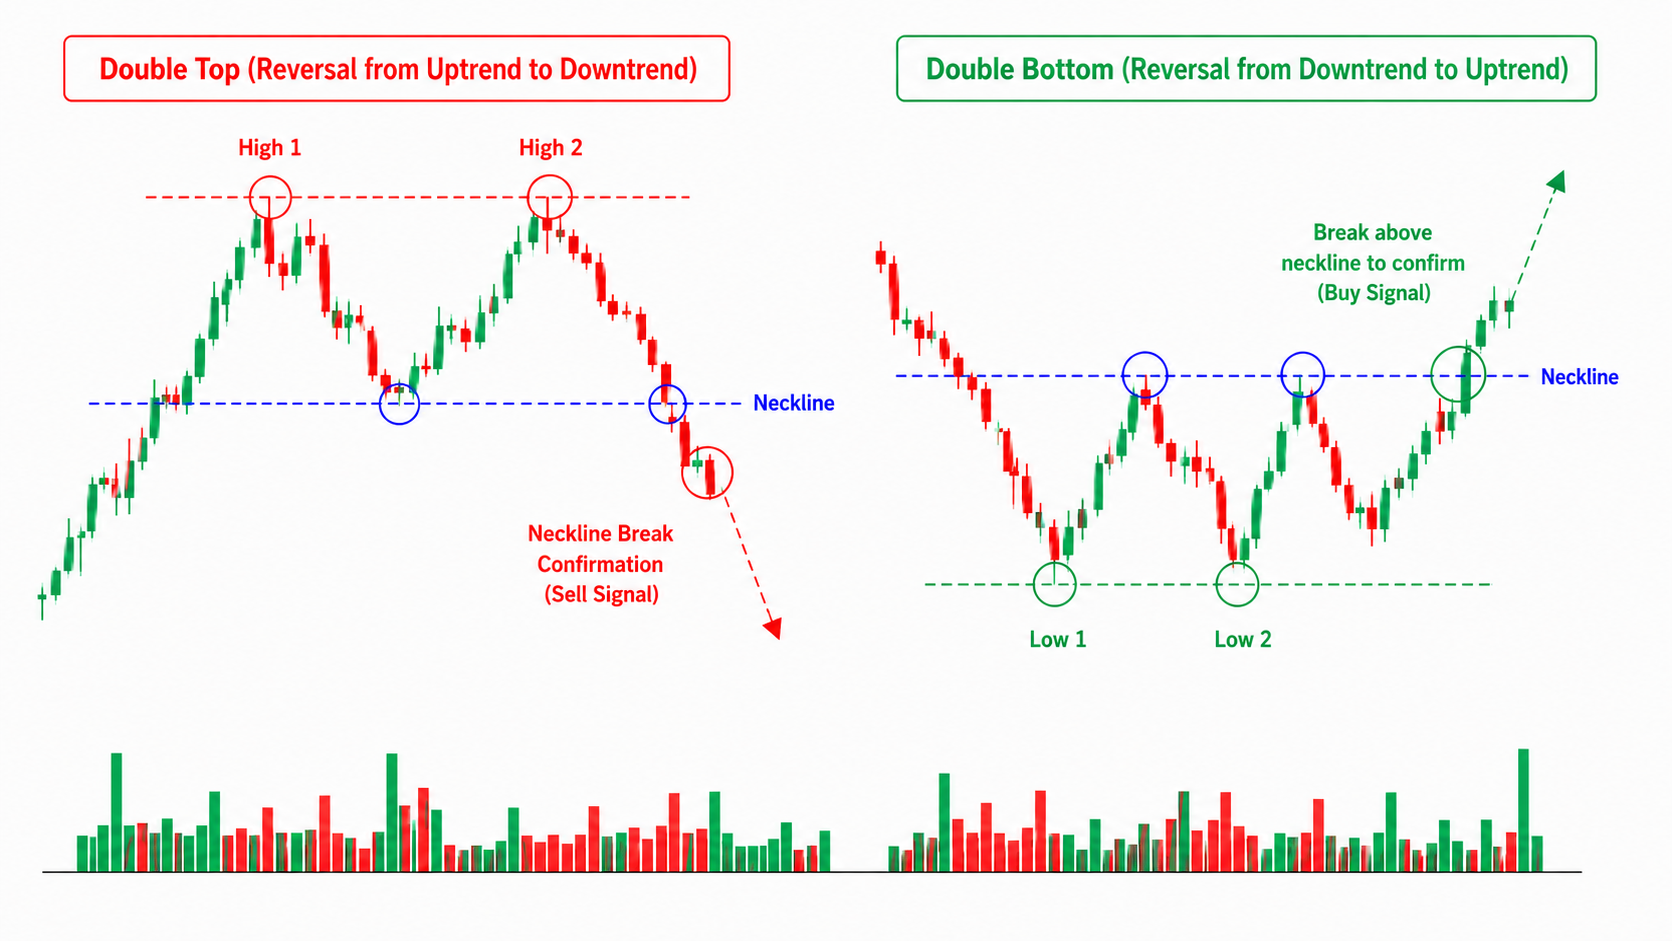
The catch is that it's only complete once the neckline breaks. While the second peak is forming, price can still take out the high and keep rising. Enter before the neckline gives way, and the shape can reverse without ever completing. If you use double tops, you need to set the completion condition as "neckline break," not "second peak," and decide for yourself where you call it complete.
Head and shoulders
A shape of three peaks where the middle (the head) is highest and the two outer peaks (the shoulders) are lower is a head and shoulders. Appearing late in an uptrend, it's watched as a reversal cue. It completes on a break below the neckline drawn through the lows of the three peaks — the same logic as a double top. The inverse head and shoulders is the flipped version, a cue for a reversal from down to up.
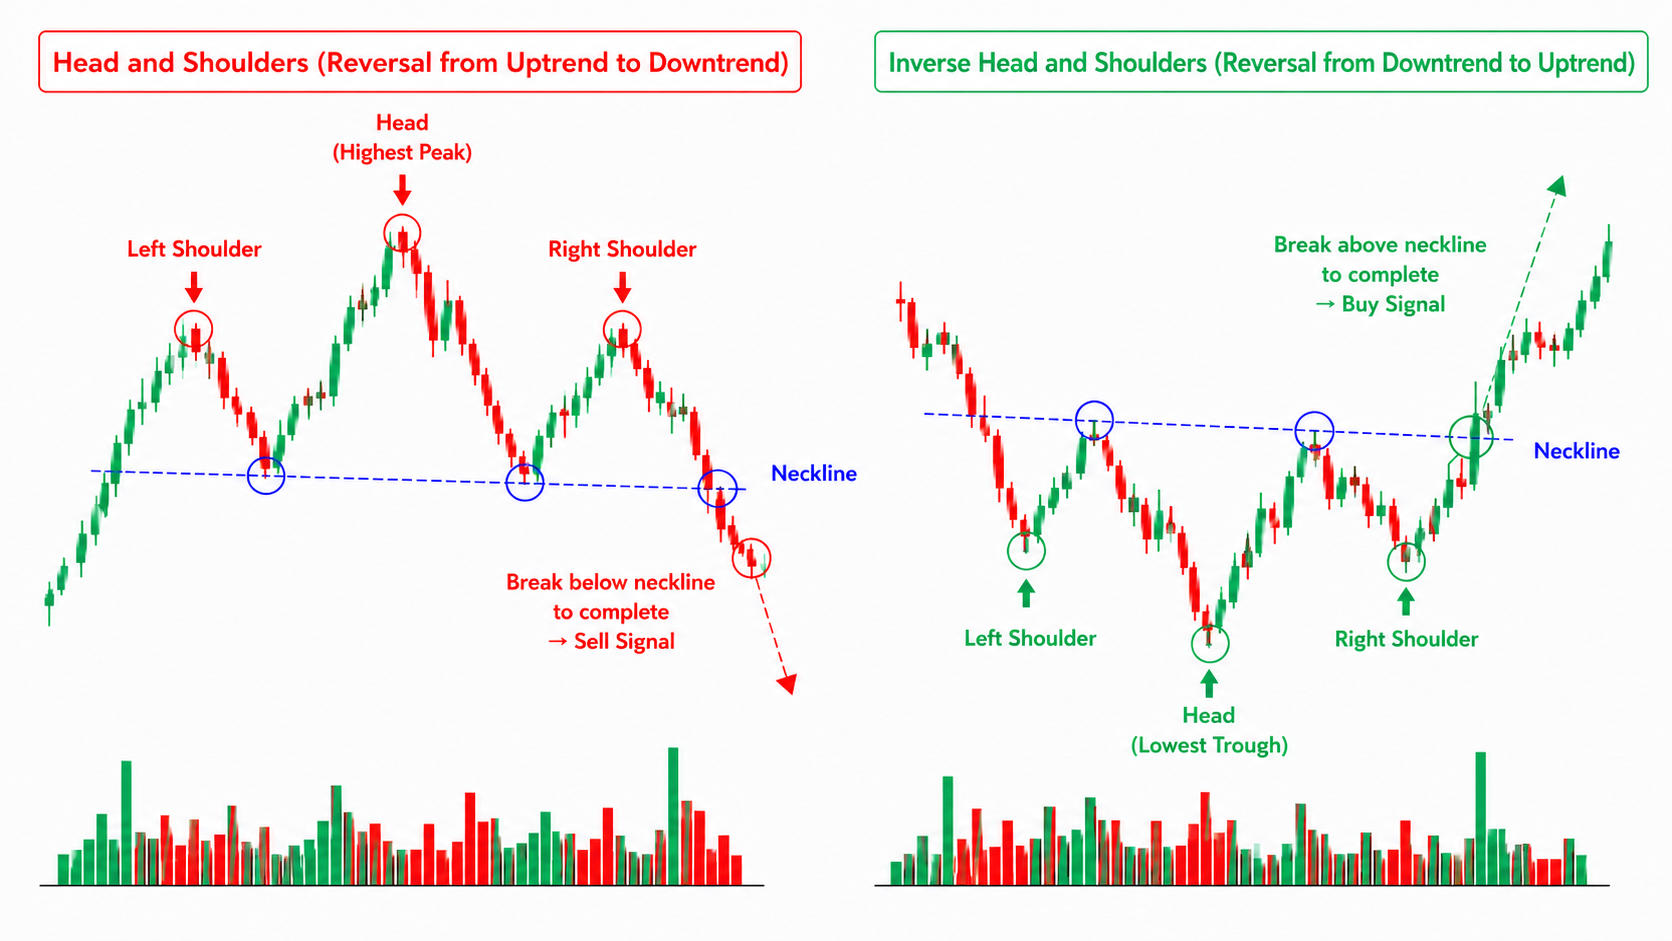
The catch is that the two shoulders often aren't level. A textbook-clean symmetric shape is rare in practice; shoulder heights and neckline slope vary. When "how much deviation I still count as the same pattern" is vague, judgment wobbles. Whether you wait only for clean shapes or allow some deviation — set that standard for yourself through backtesting, and your judgment steadies.
Triangle
A shape where highs step down and lows step up, the range converging steadily, is a triangle. Two lines through the highs and lows narrow like a triangle, and it eventually breaks one way. A narrowing range is read as energy building, and price is said to move sharply in the break's direction. There are variants — an "ascending triangle" with a flat top, a "descending triangle" with a flat bottom.
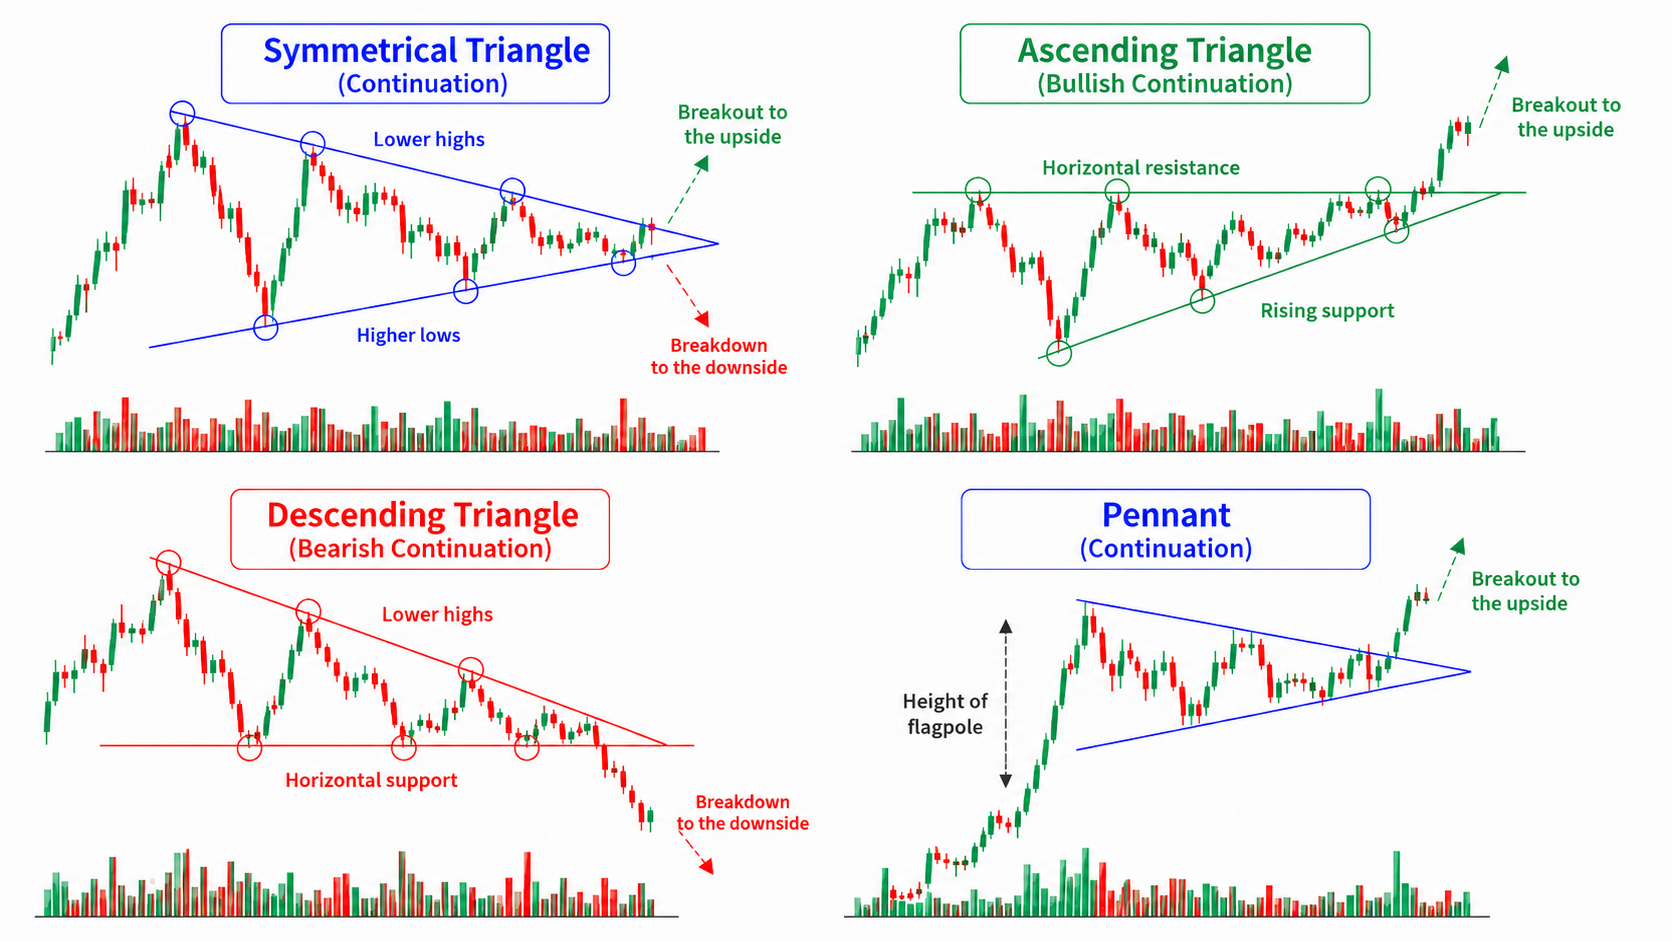
The catch is that which way it breaks isn't knowable in advance. A triangle is a "move after the break" pattern, so committing to a direction before the break means a loss when it breaks the other way. If you use triangles, decide whether you take a position before the break or enter after confirming it, and — alongside the breakout approach — backtest it including how you deal with false breakouts.
Flag / pennant
A shape where, after a strong move up (or down), price pulls back slightly or goes sideways in a pause is a flag or a pennant. It's read as a continuation cue rather than a reversal — the view that after the pause, price resumes in the original direction. It catches the "landing" mid-move, close in spirit to buying the dip or selling the rally.
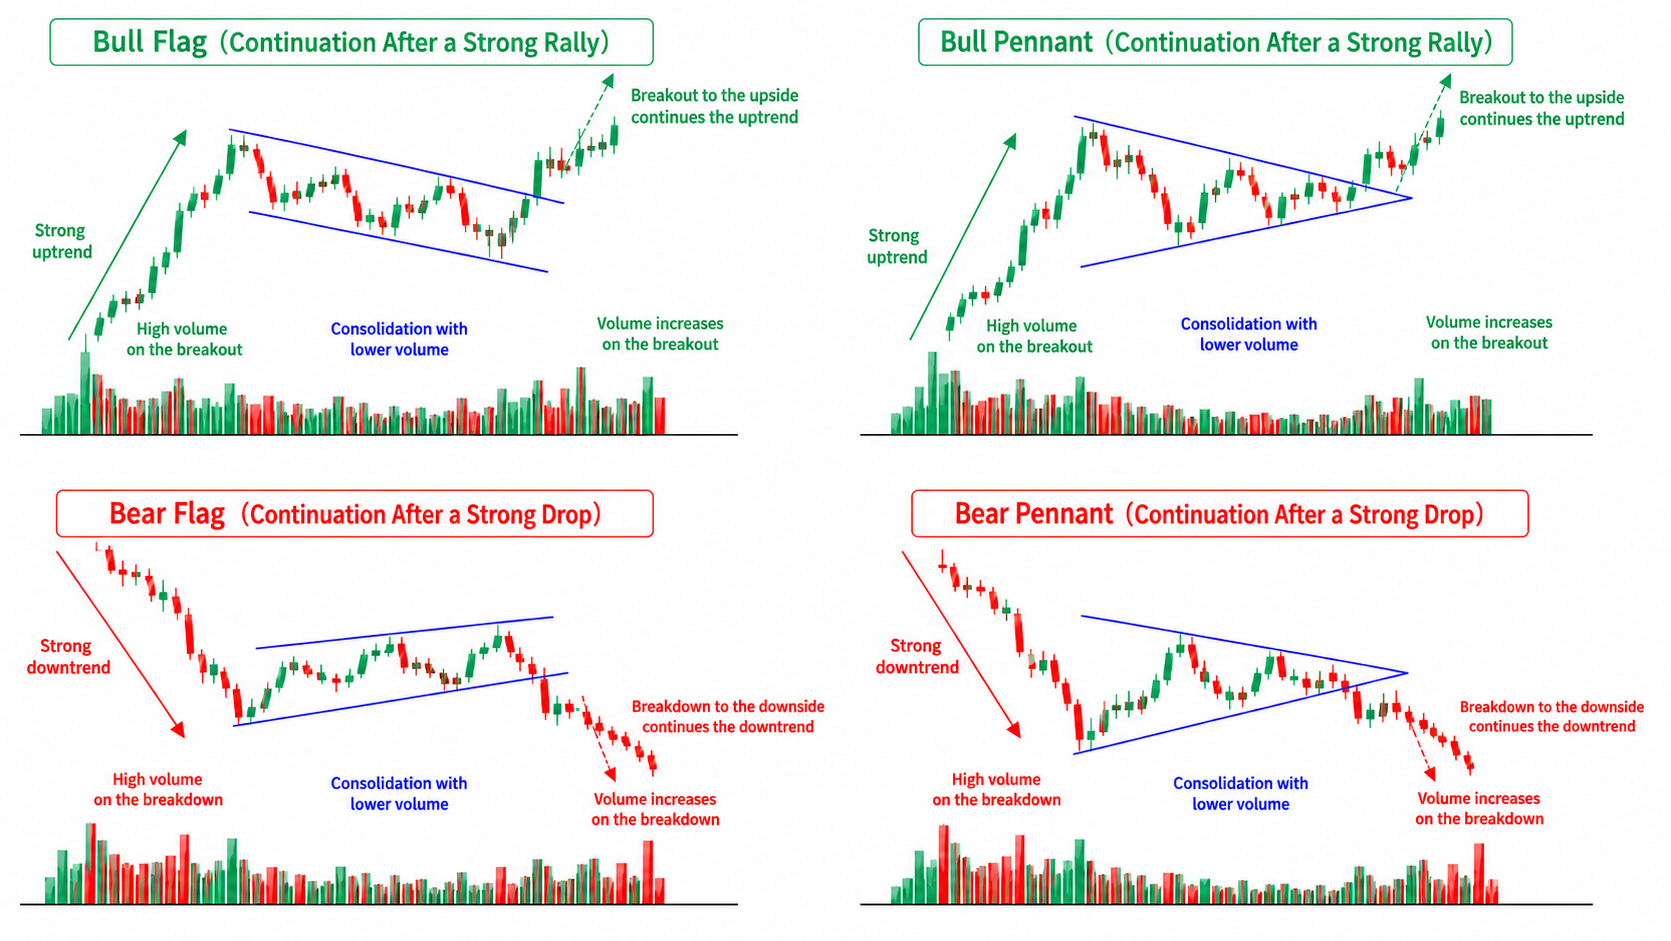
The catch is that you have to judge whether it's a "pause" or "the start of a reversal." Enter expecting the trend to continue, and it may turn out to be the doorway to a top. If you use flags, you need to confirm the strength of the original trend and the direction of the break out of the pause, and set the condition for calling it a continuation. As part of a trend, it runs continuous with trend following.
Cup with handle
A shape that forms a rounded bottom like a cup, then rises after a small pullback on the right (the handle) is a cup with handle. A continuation pattern that takes a relatively long time to build: selling pressure fades at the rounded bottom, and after the small pullback of the handle, it completes on a break above resistance. It's often discussed on longer-term US stock charts.
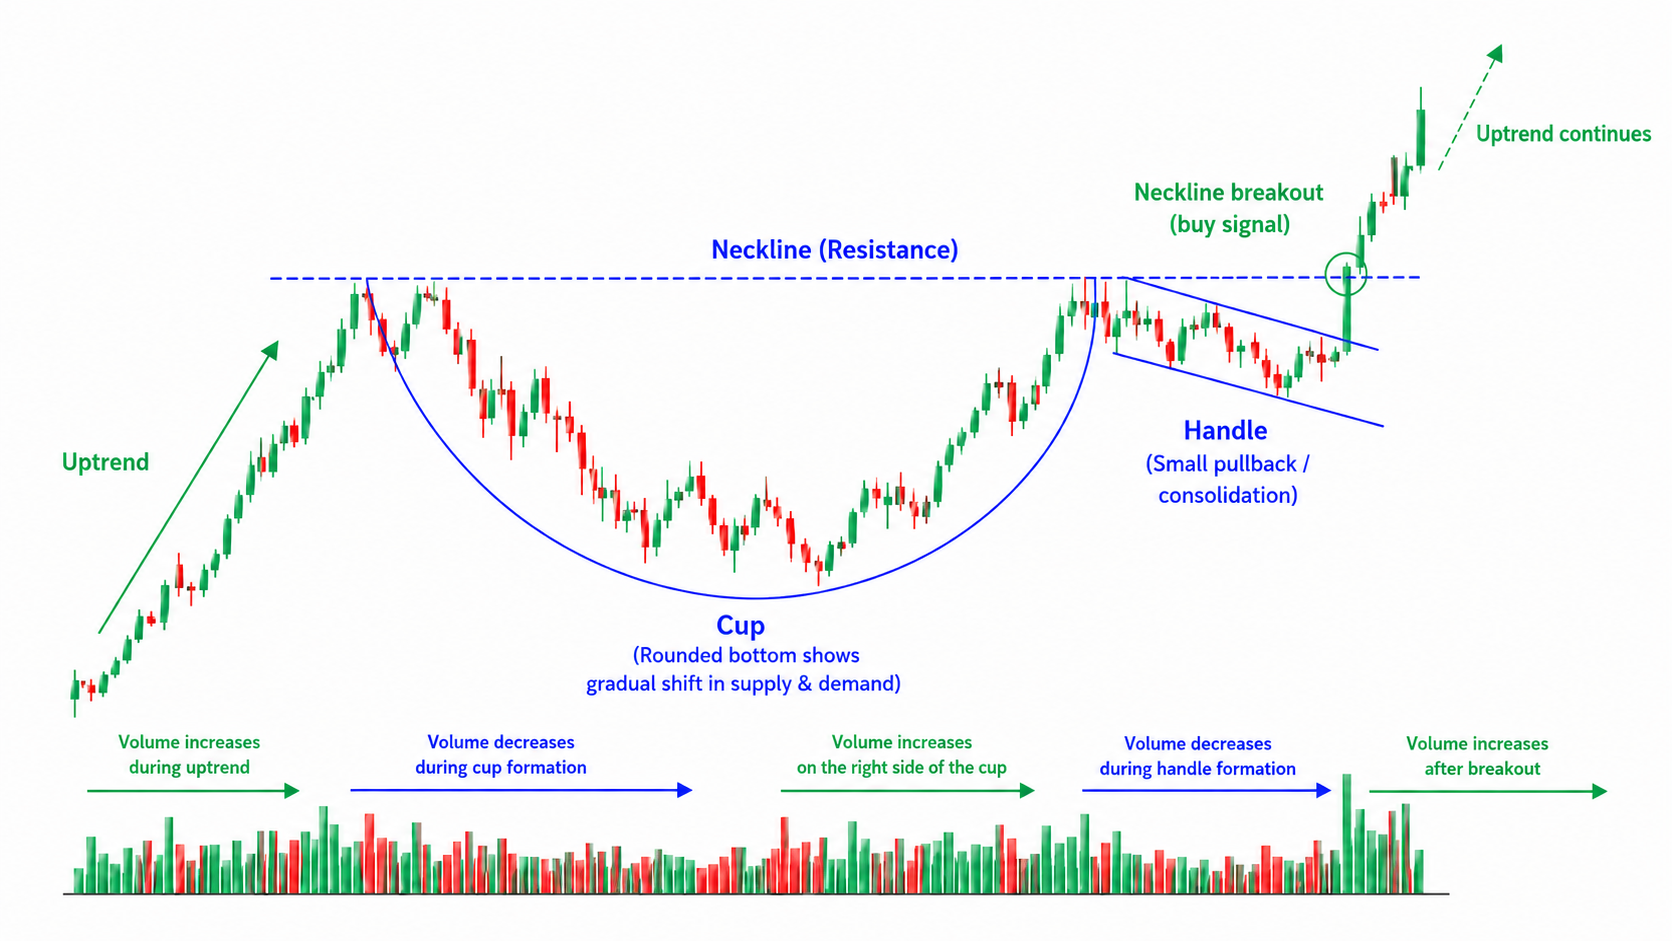
The catch is that the shape is large and takes time to complete. The cup alone can span weeks to months, and the shape can break down while you wait for completion. The "rounded bottom" also has latitude in interpretation — how much you count as the cup varies by person. If you use a cup with handle, it's important to work out, concretely through backtesting, how you judge completion on a long timeframe.
The key point: most of these patterns are combinations of support and resistance and breakouts. The neckline, the side of a triangle, the rim of a cup — each is a support or resistance line, and clearing it is the completion condition. More than memorizing pattern names, drawing the lines and judging the break is the foundation.
How to deal with false breakouts (failed patterns)
What trips traders up most with chart patterns is the false breakout. A false breakout is a move that looks like the pattern completed and cleared a level, only to snap back and run the other way. The classic: "I sold because the double top's neckline broke, then it snapped back and rose."
There's no way to avoid false breakouts entirely, but there are ways to reduce them. One is to confirm the break on the close: even if price pierces the line for a moment, a close back on the other side suggests a false breakout. Another is to wait for the "retest" after the break — wait for price to come back to the line it broke and confirm it acts as support or resistance there (role reversal) before entering. Both reduce false breakouts by "waiting a beat instead of jumping on."
That said, the more you wait, the fewer false breakouts — but the later you enter once it's moving, so the smaller the move you capture. "Enter early and take the false-breakout risk" versus "confirm and shave off some of the move" is a trade-off. Which fits your symbols and timeframes isn't something you settle by arguing — only by backtesting.
Why backtest it
There's no single right answer to "which shapes you treat as valid," "where you call it complete," or "how you deal with false breakouts." On the same chart, someone waiting only for clean shapes and someone allowing some deviation will enter a different number of times, in different places. Which standard fits the symbols and timeframes you trade isn't settled by arguing. The only way to answer it is through repeated testing.
This is where chart replay (backtesting) earns its place. You rewind a past chart, find a pattern your own way, then step through it one bar at a time to confirm "does this shape actually complete and move as expected?" without seeing what comes next. You're using virtual funds, so there's no real loss, and you can test "how well my read worked in the past" over and over. Your eye for finding shapes, and your judgment for dodging false breakouts, both sharpen the more reps you run.
Define entries and exits together
When you use chart patterns too, most mistakes come from setting an entry condition and skipping the exit. Always put entries and exits into words as a pair.
Entry (when you get in)
- Which pattern you target (double top / triangle / flag, etc.)
- How you judge completion (neckline close-break / side break / retest confirmation)
- How you handle false breakouts (close confirmation, waiting for a retest)
Exit (when you get out)
- Stop: the price that admits the pattern failed (price closed back across the line it broke, etc.)
- Target: where you take profit (the pattern's measured height / the next support or resistance / scale out part and let the rest run)
If you tie your stop to the pattern failing — "I sold on the neckline break, but if price closes back above the neckline, the pattern failed, so I'm out" — the decision to exit is less driven by emotion. When the reason you entered (the shape completing) breaks, you exit. Setting up that pairing first is the core of building a rule around chart patterns.
Sample strategy-rule entries (two patterns)
ENTRIQ's strategy tags include a strategy-rule field where you write down your own rules. Putting how you use chart patterns into words there lets you check, after every backtest, whether you actually entered the way you planned. There are two broad ways to write them. Neither is better — pick whichever lets you reproduce your decisions more reliably.
Pattern A: Discretionary (define the situation in words)
The discretionary style. You define context, entry, stop, exit, and skip conditions in words, without locking them to numbers.
Context: Late in an uptrend, a clear double top has formed and a neckline can be drawn. Skip when the shape is distorted. Entry: Sell on a clear close below the neckline. Or sell after confirming the retest of the broken neckline. Stop: If price closes back above the neckline, call the pattern failed and exit. Exit: Consider taking profit at the target a double-top's height below the neckline. Skip: Don't enter when the two peaks differ greatly in height, or right before major data releases.
Pattern B: Rules-based (spell the conditions out in numbers)
The rules-based style. You fix the decision with indicators and numbers, so anyone reading it reaches the same conclusion.
Context: Target double tops where the two highs sit within (a set %) of each other. Entry: Sell when the day closes (a set %) or more below the neckline. Stop: Exit if the close moves back above the neckline (or neckline +2%). Target: Take profit at neckline − (the pattern's height). Filter: The pattern must take at least (a set number of) bars to complete.
Numbers make your review quantitative and easier to aggregate in a backtest. But the figures here — 2%, a set number of bars — are only examples of how to write a rule. They don't guarantee any edge or profit. Backtest them on your own symbols and timeframes, and adjust as the data tells you.
Test it, then record it
Once your rules are in words, pull up past charts, find spots where patterns appear, and run virtual entries and exits without seeing the future. After each one, log whether you entered by the rule and whether the shape completed or was a false breakout in your trade journal and strategy tags.
One strategy tag per trade. Tag it something like "Double top," and you can later pull up just those trades to see win rate, P&L, average risk-reward, and so on across the whole pattern.
A caution here: don't take the numbers at face value while your sample is small. Judging a pattern on 5 or 10 trades is far too early. Build up enough repetitions in risk-free backtesting first, then look at the pattern.
The chart above shows how the data might look when you test by false-breakout approach (it's sample data, not real results). Same pattern, different completion judgment or false-breakout handling, different numbers — seeing that difference for yourself is the whole point of backtesting.
You can also review what you've logged with AI analysis. AI analysis isn't a trade signal or a recommendation — it identifies and describes patterns from your past trade data and notes. It can surface things you'd miss on your own, like "the trades where I allowed a distorted shape stopped out more often."
Four common mistakes
- Jumping on an unfinished shape. Enter just because a second peak formed or a triangle narrowed, and it can reverse without completing. Set a completion condition — a neckline break, a side break — and wait for it.
- Entering with no plan for false breakouts. Jump on every break and false breakouts run your stops. Decide your own approach — close confirmation, waiting for a retest.
- Entering with no stop tied to the pattern. Patterns fail too. If your exit isn't tied to the pattern failing, a failure runs your loss wide.
- Demanding too clean a shape, or allowing too much distortion. Wait only for textbook shapes and your count drops; allow too much distortion and false breakouts rise. Work out, through backtesting, how much you count as the same pattern.
FAQ
Q. Do chart patterns actually work? A. There's no "they always work." The backdrop — many participants watch the same shape, so orders cluster at the level — is real, but false breakouts happen often. What matters is confirming, through backtesting on your own symbols and timeframes, how well a given pattern has worked in the past, as your own data.
Q. Of all the patterns, which should I learn? A. You don't need them all. Most patterns are combinations of support and resistance and breakouts, so build the foundation of drawing lines and judging breaks first, then deepen the one or two patterns you actually use through backtesting.
Q. Is there a way to avoid false breakouts entirely? A. No. Confirming on the close or waiting for a retest after the break reduces them, but you enter later and capture a smaller move for it. False-breakout risk and the size of the move are a trade-off, so confirm which balance fits through backtesting.
Q. Should I write the strategy-rule field discretionary or rules-based? A. Either works. If defining the situation in words is easier for you to reproduce, go discretionary; if you'd rather lock conditions to numbers, go rules-based. Writing both is fine too. What matters is that you can reproduce the same decision later.
Q. Which markets can I backtest chart patterns on? A. ENTRIQ's backtesting supports US stocks, FX, commodities, and crypto. Japanese stocks are planned for a future release. You can also view multiple timeframes at once, which helps when you confirm a large shape on a higher timeframe while targeting completion on a lower one.
Chart patterns sound simple put as "enter when this shape appears," but whether you can profit from them comes down to judging completion, dealing with false breakouts, and your stop when the shape fails. Write the completion condition and your exit into the strategy-rule field as a pair, and test them on past charts again and again.
ENTRIQ is a chart replay and backtesting platform for individual traders, combining chart replay, trade journaling, and AI analysis.
This article does not guarantee the effectiveness or profitability of any strategy or rule. The figures and examples shown are samples to illustrate how to write rules, not indications of investment results. You are solely responsible for your own investment decisions.
Reproduce this validation yourself
With ENTRIQ's chart replay, you can trade through past charts using the same rules.
Start 14-day free trialValidate your method on past charts
The same validation in this article can be reproduced with your own method. On past charts, do the classics really work?
- ✓ Replay past charts
- ✓ AI feedback on your trades
- ✓ Validate methods with statistics