Pullback Depth|How Far to Wait, Judged by Backtesting
How deep to wait on a pullback: prior lows, moving averages, and retracement percentage as depth gauges, and using backtesting to set how deep you call a pullback.
You jumped into a shallow pullback, only to find the real pullback was much lower — and you got dragged down with it. Or you kept waiting for a deeper entry, and the price bounced and ran without you. If you've ever tried buying pullbacks, you probably know this "how deep do I wait?" dilemma. The single hardest part of trading pullbacks is exactly this: how far down do you wait before you enter — judging the depth.
This article builds on the method covered in Pullback Trading Strategy: Buy the Dip, Backtest Your Rules, zooming in on one thing only: how deep a pullback you wait for. We'll cover what depth is, the gauges you can use to measure it, the trade-off between shallow and deep pullbacks, and how to write your depth criteria into ENTRIQ's strategy-rules field (with two example write-ups). This isn't about how long to "ride out" a drop — it's about deciding your own depth criteria, putting them into words, and checking them over and over on past charts.
There is no single "correct" pullback depth. What matters isn't guessing the perfect depth — it's deciding, as your own criterion, how far a price has to fall before you'll call it a pullback.
What "pullback depth" means
Pullback depth is how large the drop is when price pulls back temporarily during an uptrend. A small drop that quickly bounces is a "shallow pullback"; a large drop back toward the start of the move that then bounces is a "deep pullback." Even within the same uptrend, what counts as a "pullback" varies from trader to trader.
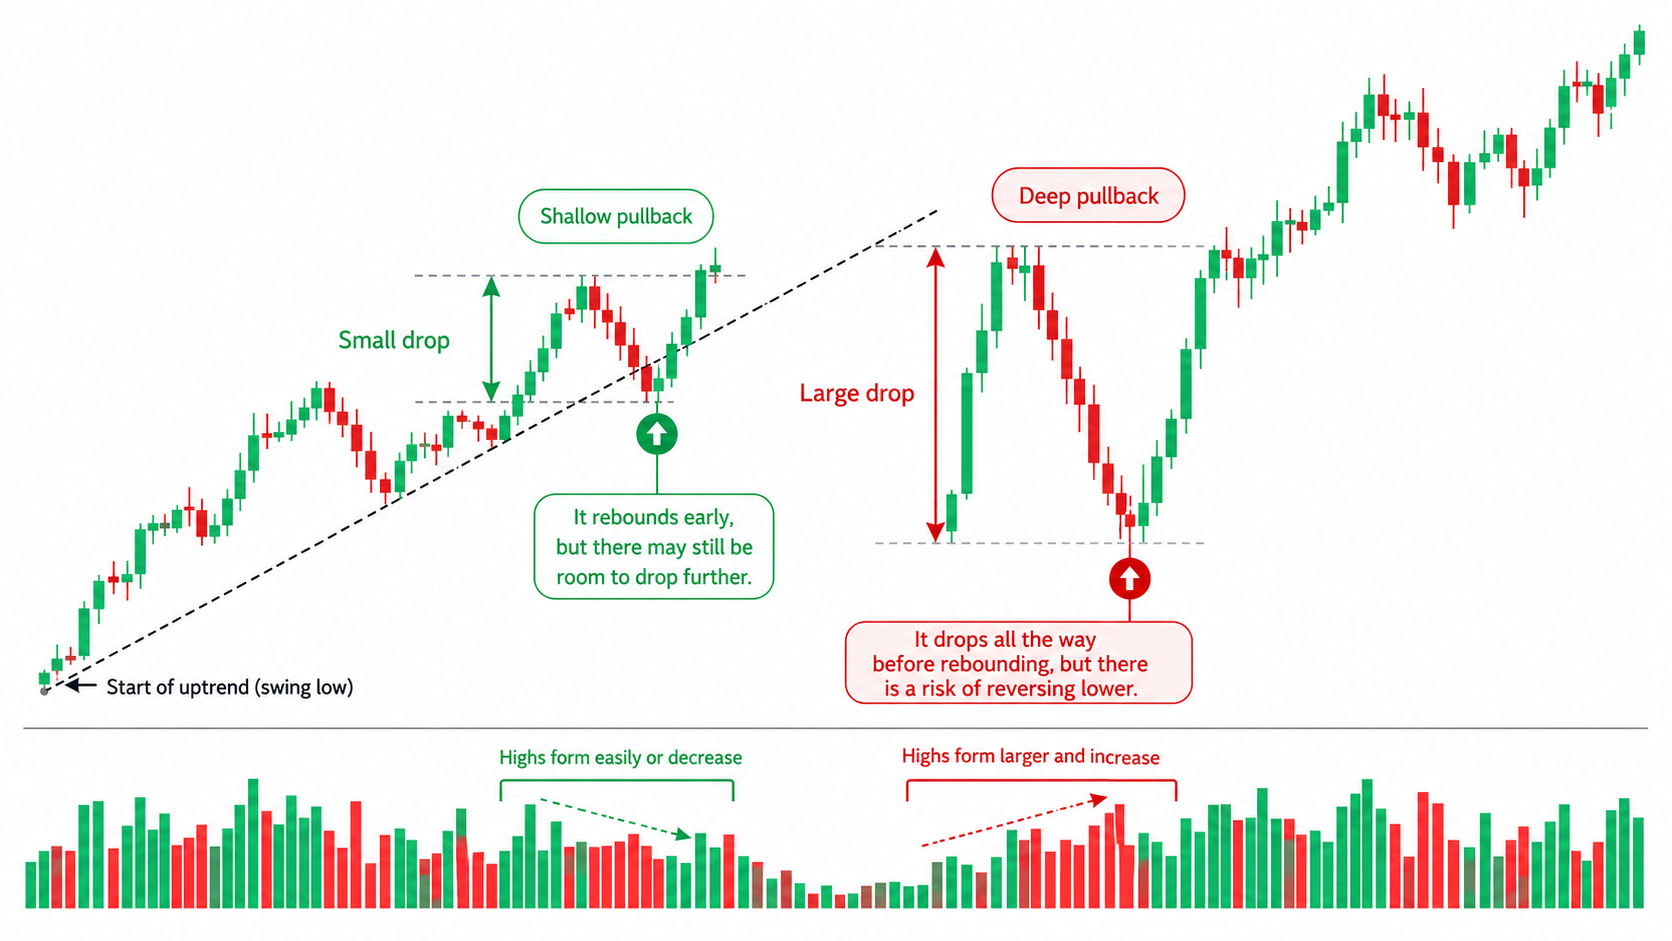
Depth is the heart of the method because where you enter drives both your subsequent P/L and your risk of the drop continuing. Enter shallow and you get on early, but there may still be room to fall. Wait for a deeper entry and you get on after the drop has played out, but price may bounce and leave before you get in. So how you set your depth is the central decision in pullback trading — it determines the balance between "can I enter at a favorable price?" and "will I get caught in a continued drop?"
The hard part of pullback depth is that "while price is falling, you can't tell whether this is the bottom of a pullback or the start of a trend reversal." A chart that looks like a "clean pullback" in hindsight might still have been falling further in the moment. What matters isn't calling the exact bottom — it's deciding how far a drop you'll treat as a pullback and where you'll judge it a reversal, and using backtesting to grasp how well that criterion has worked in the past.
Gauges for measuring pullback depth
There are several kinds of gauges for measuring pullback depth. Rather than declaring any of them "the right answer," here they are laid out neutrally as commonly used options. Which one you make your criterion is something to confirm with your own records for your instrument and timeframe.
| Gauge | The idea | Watch out for |
|---|---|---|
| Prior low / previous pullback | Use a recently defended low, or a drop about as deep as the previous pullback, as your reference | It won't be the same depth every time |
| Moving average | Use a bounce near a rising MA as your pullback reference | Which MA works varies by instrument and timeframe |
| Retracement percentage | Measure depth by how much of the prior up-move price has retraced (as a percentage) | Percentage alone doesn't set the bottom |
| Support level | Use a drop down to a support that has held before as your reference | A line won't always hold |
| Sign the pullback is ending | Wait for a bullish reversal candle or another sign the pullback is ending before entering | The longer you wait to confirm, the worse your entry price |
Let's look at each a little more closely.
Prior low / previous pullback
The most basic gauge is a recently defended low, or the price zone where the previous pullback bottomed. The thinking is that while an uptrend continues, price is often supported again at roughly the same depth as the last pullback, so you treat that level as "if it holds around here again, it's still a pullback." Because it's a price actually printed on the chart, the rationale is easy to see, and since many participants are watching the same low, it tends to be a level people pay attention to.
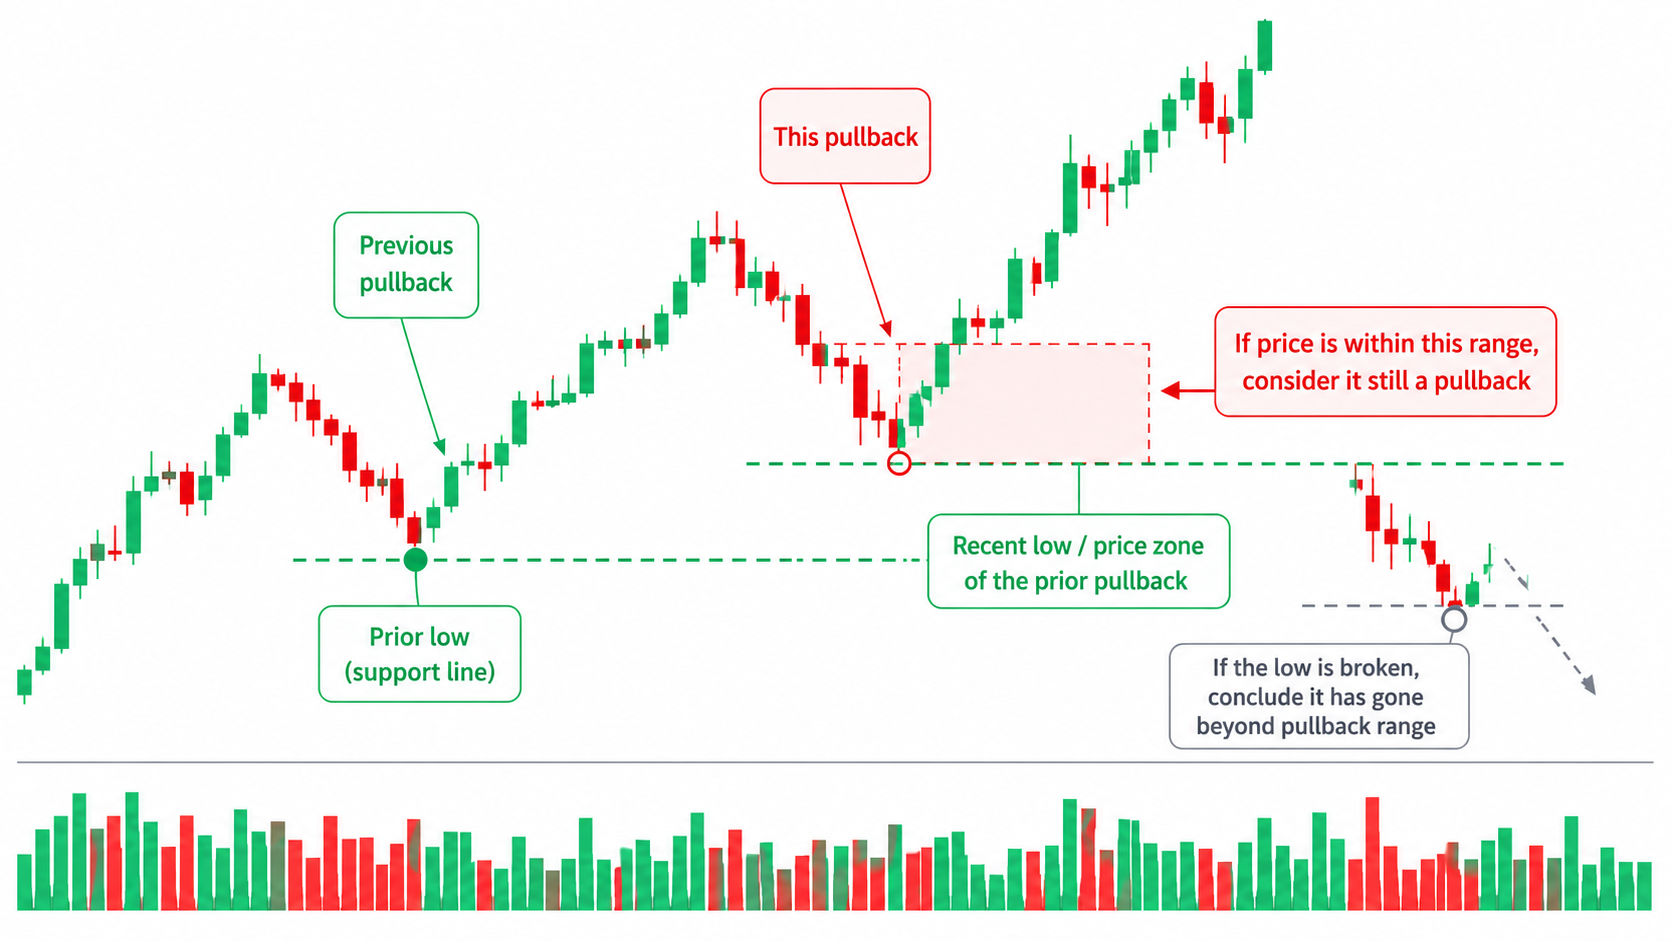
The catch is that it won't be the same depth every time. Last time may have bounced shallow, but this time price can break the prior low and keep falling — that happens routinely. If you use the prior low as your gauge, you also need to decide "what do I conclude if that low breaks (has it gone beyond pullback range?)," or you'll be stuck once it breaks.
Moving average
This is the view that treats a move where price drops near a rising moving average (20-MA, 50-MA, etc.) during an uptrend and bounces as a pullback candidate. Because the MA rises along with the trend, it tends to be a gauge you can use repeatedly for as long as the trend lasts.
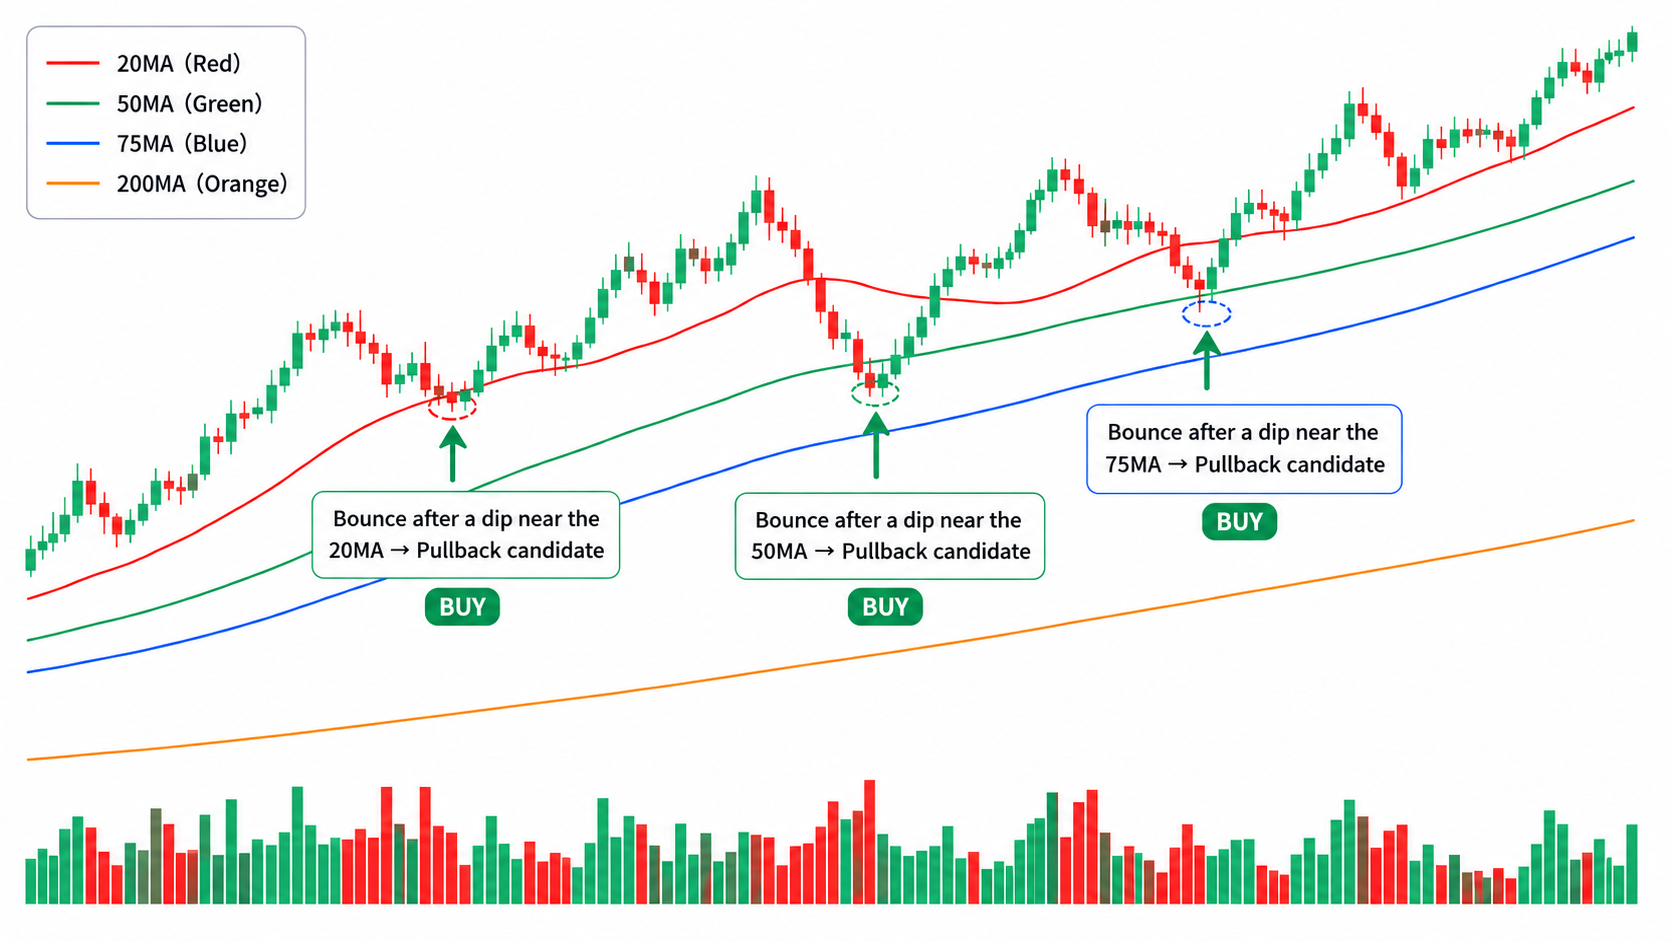
The catch is that which MA works varies by instrument and timeframe. One name bounces cleanly off the 20-MA, while another only bounces after pulling all the way back to the 50-MA. The idea of using an MA as a depth gauge is nearly the same point as "bounces off the MA" covered in How to Use Moving Averages. Which MA works best is something you check per instrument and timeframe.
Retracement percentage (Fibonacci retracement, etc.)
This view measures depth by how much of the prior up-move price has retraced, as a percentage. For example, "a candidate once it retraces half (50%) of the up-move," or "a candidate at the 38.2% or 61.8% retracement" — using tools like Fibonacci retracement, you base the criterion on the ratio of the pullback to the prior advance. Because you're looking at a ratio rather than the raw point move, you can measure depth the same way whether the advance was large or small.
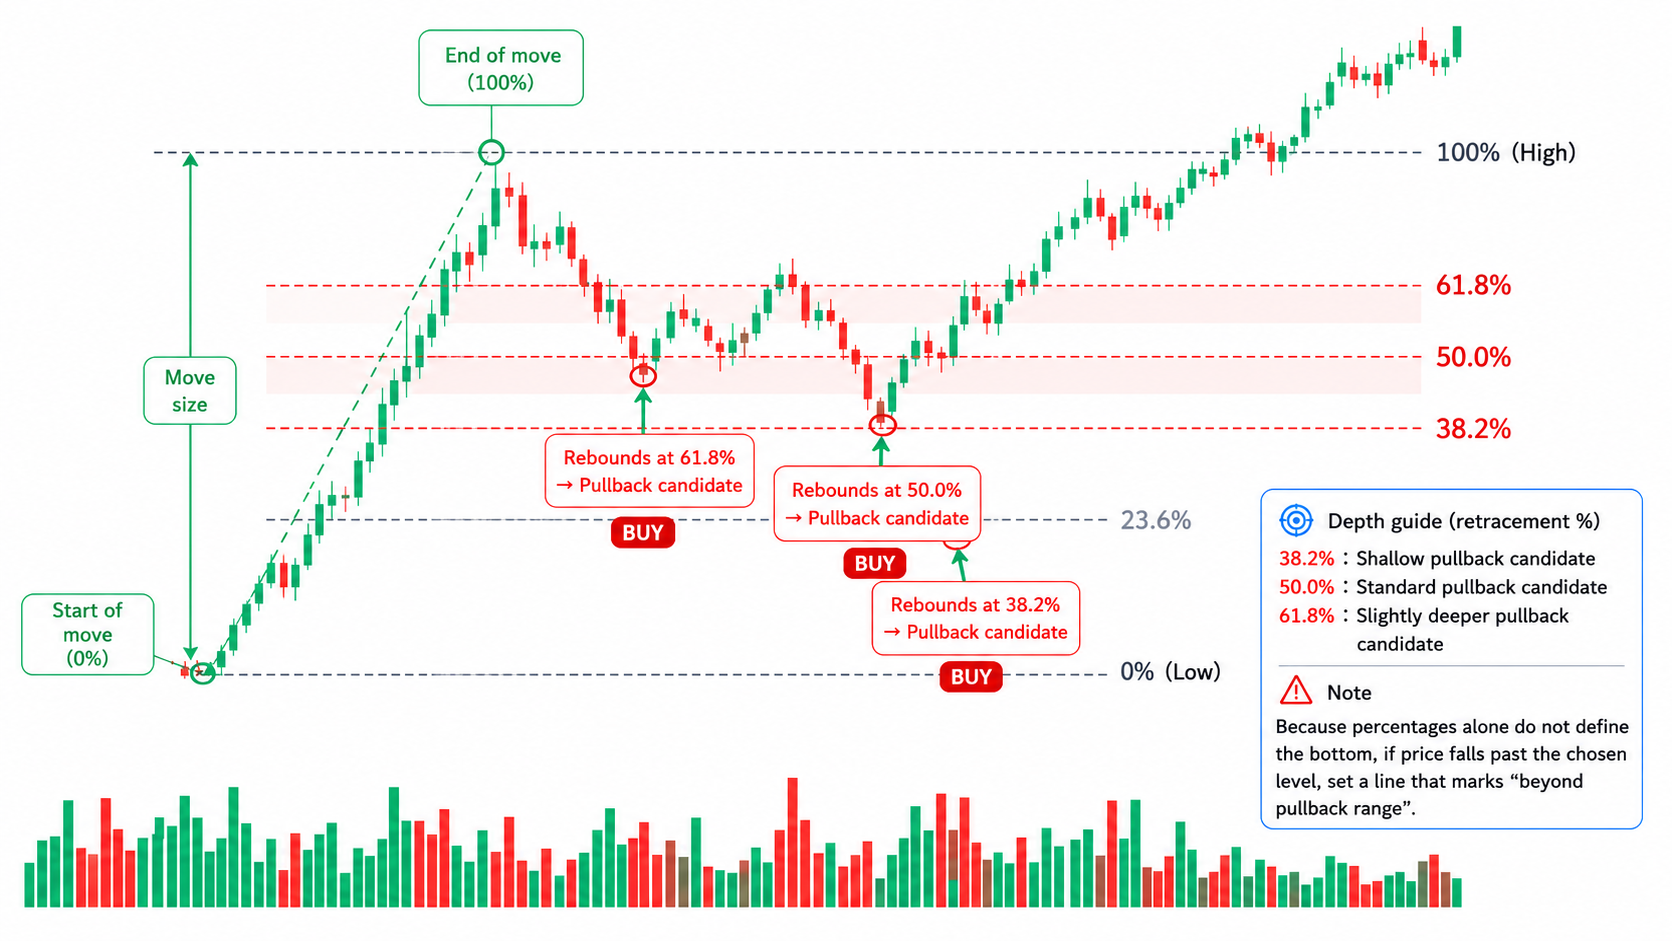
The catch is that percentage alone doesn't set the bottom. Even if you decide "it'll bounce at the halfway point," price can retrace the whole thing and fall back to where the advance began. If you use a percentage as your gauge, you also need to set the line at which, once price falls past that percentage, you judge it has "gone beyond pullback range."
Support level
This view uses a drop down to a support that has held repeatedly before as the pullback gauge. If price falls to that support during an uptrend, you treat it as a pullback candidate on the possibility that it's held and bounces there. It's a way of framing depth as a "support zone," and the way you draw lines in Support and Resistance carries straight over as a depth gauge.
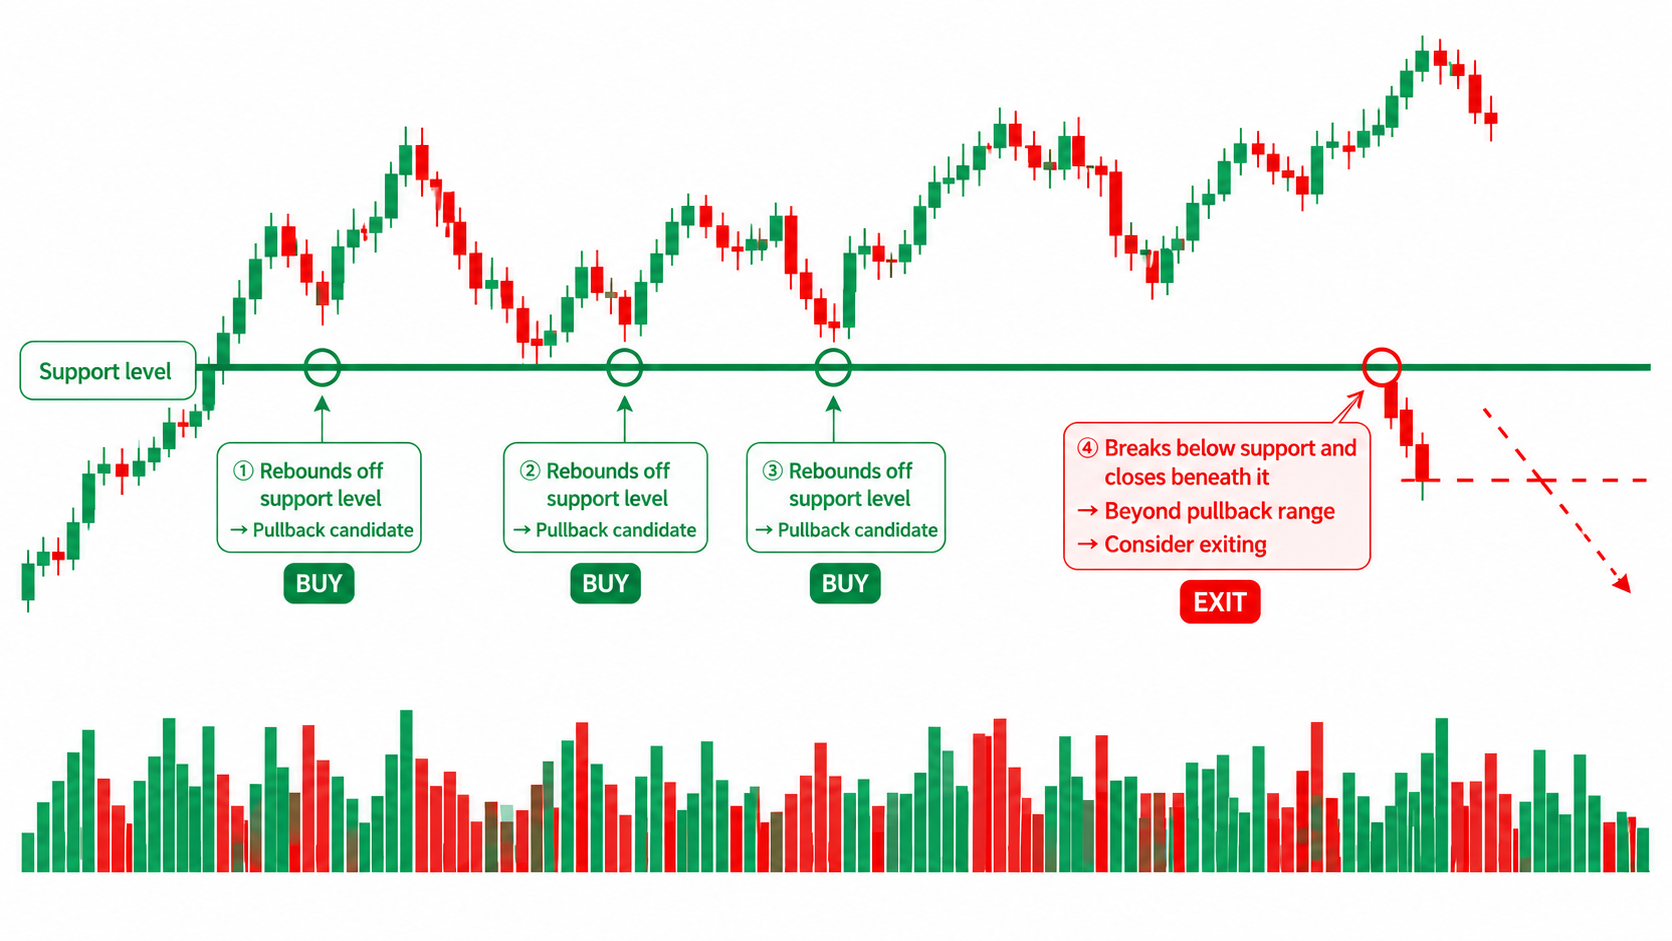
The catch is that a line won't always hold. Even a strong support can break, and after it breaks the drop can actually accelerate. If you use support as your depth gauge, it's important to decide up front on a line like "if it closes below that support, it's not a pullback — exit."
A sign the pullback is ending
This is the idea of layering onto a "price gauge" — a prior low, an MA, a support — a sign that the drop has actually stalled there, and only entering once you've confirmed it. You wait for a bullish reversal candle or another sign the pullback is ending, such as a long lower wick, an up-candle that erases the drop, or a bar that takes out the prior day's high. Adding a layer of confirmation, rather than entering just because price reached the gauge, makes it easier to avoid getting faked out.
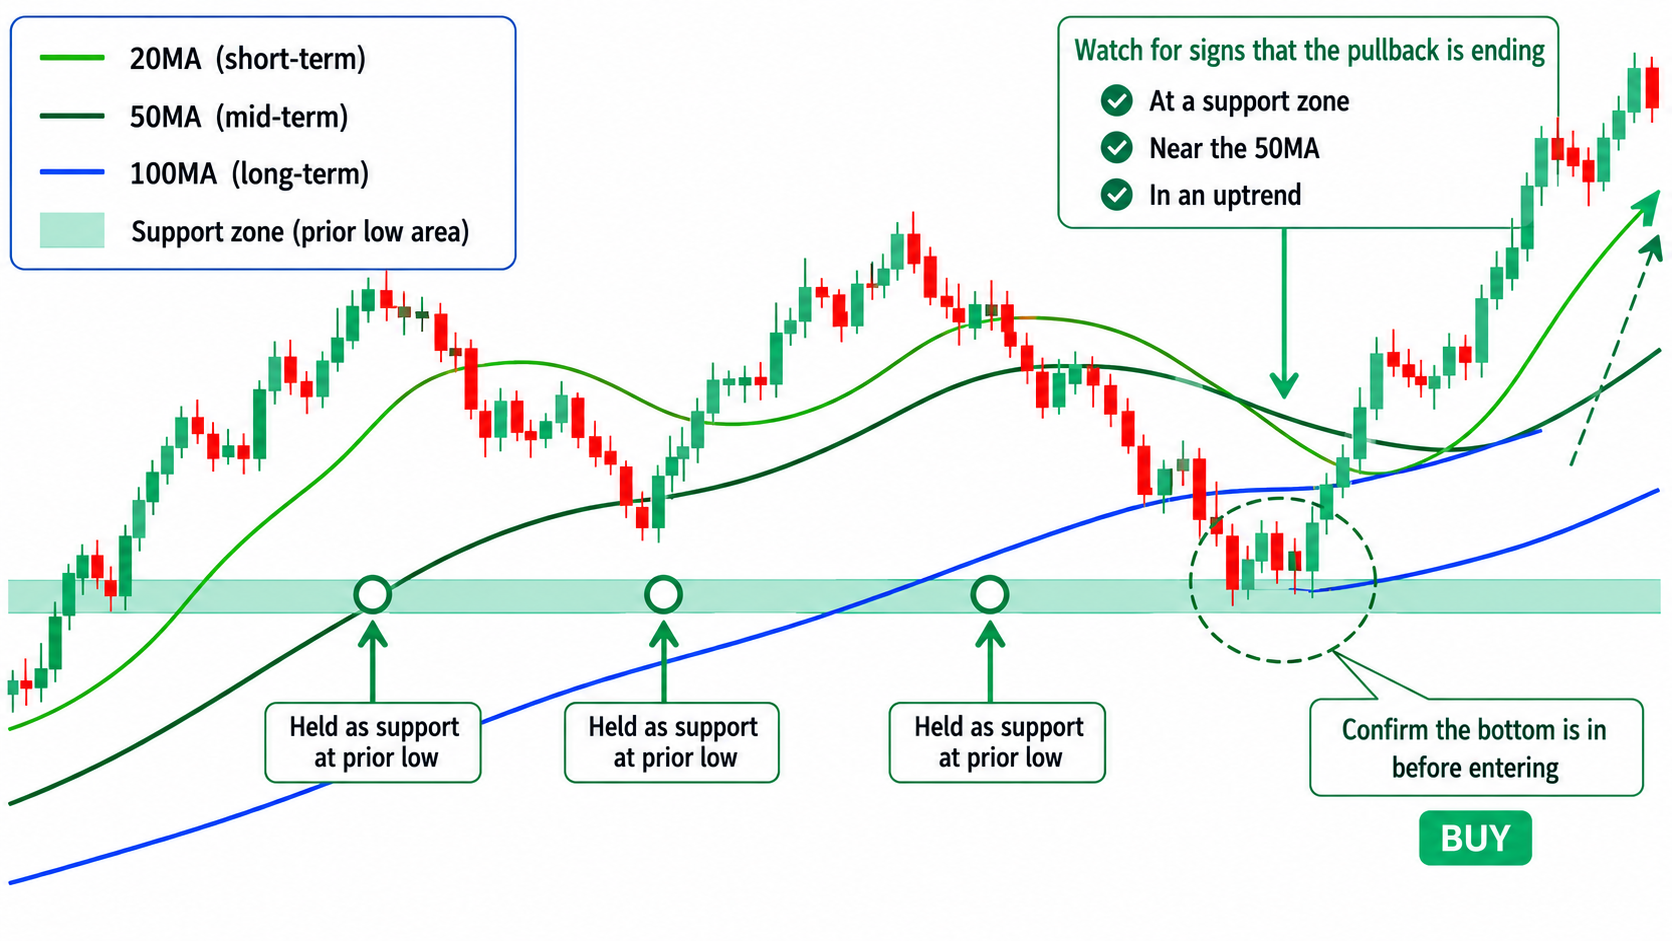
The catch is that the longer you wait to confirm, the somewhat worse your entry price. By the time that reversal signal completes, price has already recovered a bit. In other words, unlike the other gauges, this one tightens your entry-confirmation method by one step — you trade the lowest price for fewer fakeouts. How long to wait for confirmation is something you check with your records.
What's important here is that you don't have to pick just one of these gauges. The more you stack gauges — creating a confluence where a rising 50-MA and a prior support level overlap, with a reversal candle printing there — the stronger the case for the pullback. Your depth criterion is the very way you combine the gauges.
The trade-off between shallow and deep pullbacks
The core of the depth decision is the shallow-vs-deep trade-off. Both have upsides and downsides, and the approach differs by method.
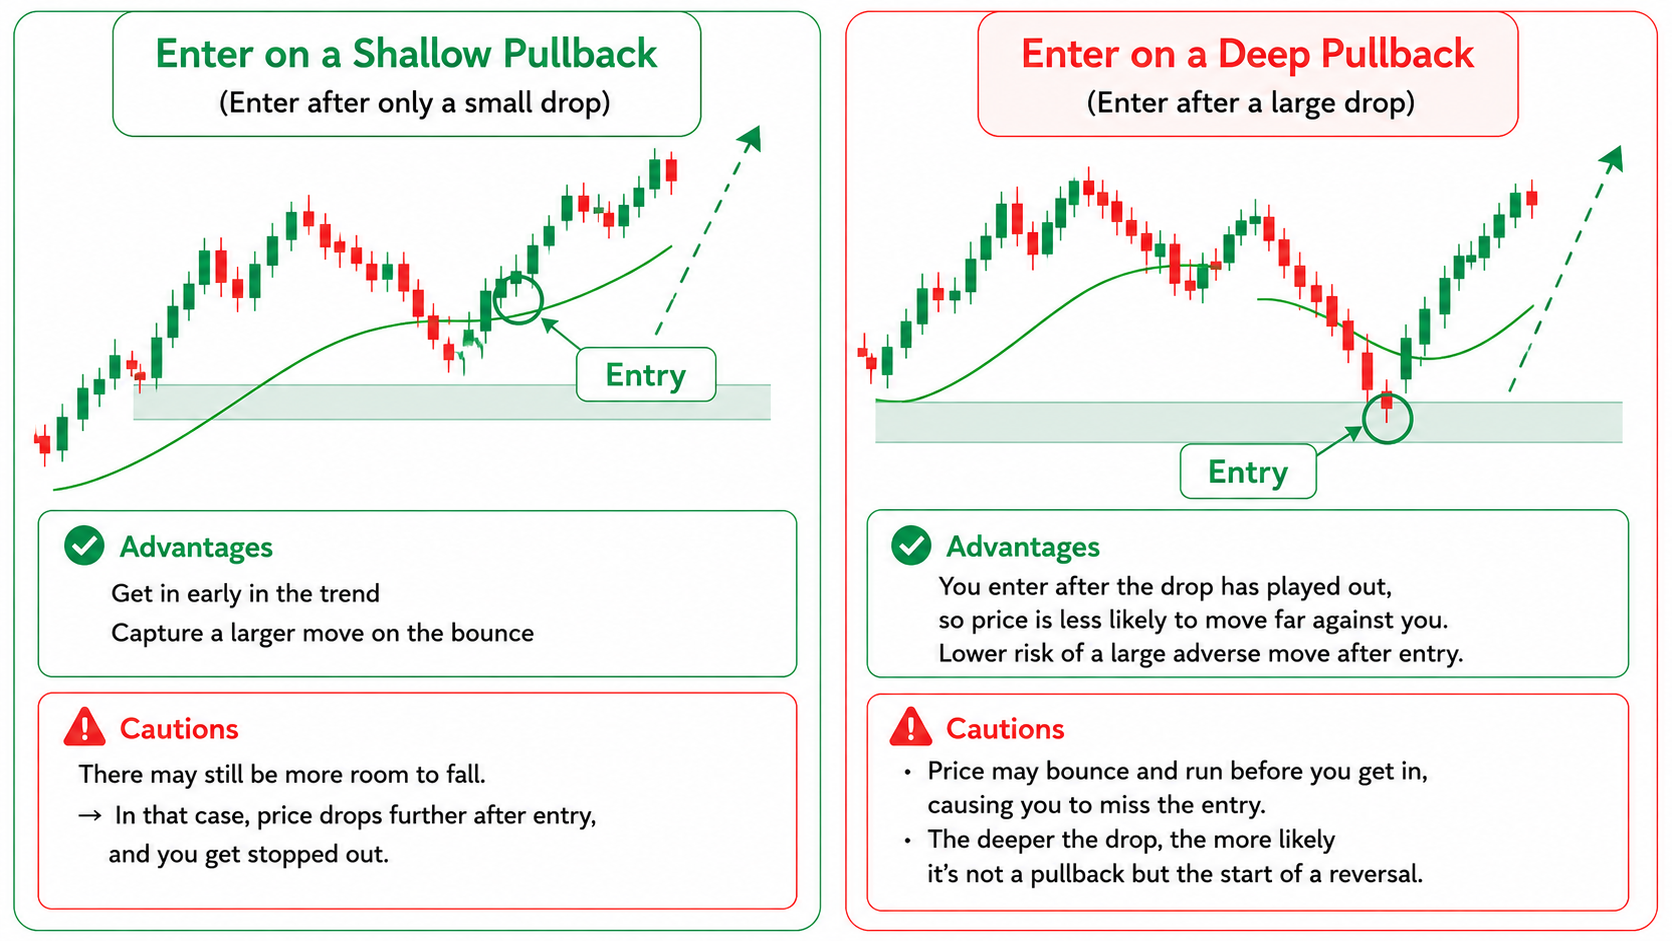
Entering on a shallow pullback (entering after only a small drop) gets you into the trend earlier and lets you capture a bigger run when it bounces. On the other hand, there may still be room to fall, in which case price drops further after you enter and you get stopped out.
Entering on a deep pullback (entering after a large drop) means you get on after the drop has played out, so price is less likely to move far against you after entry. On the other hand, price may bounce and run while you're waiting for the deeper entry, so you miss the entry entirely. And the deeper the drop, the stronger the suspicion that "this isn't a pullback — it's a trend reversal."
This shallow-vs-deep call is continuous with the "pullback or start of a reversal?" distinction covered next. Deciding your depth is at the same time deciding "how far down do I give up on the pullback."
Pullback, or the start of a trend reversal?
The hard part of pullback trading is that while price is falling, it's hard to judge whether it's a pullback or the start of a trend reversal. Mistake one for the other and the loss gets large.
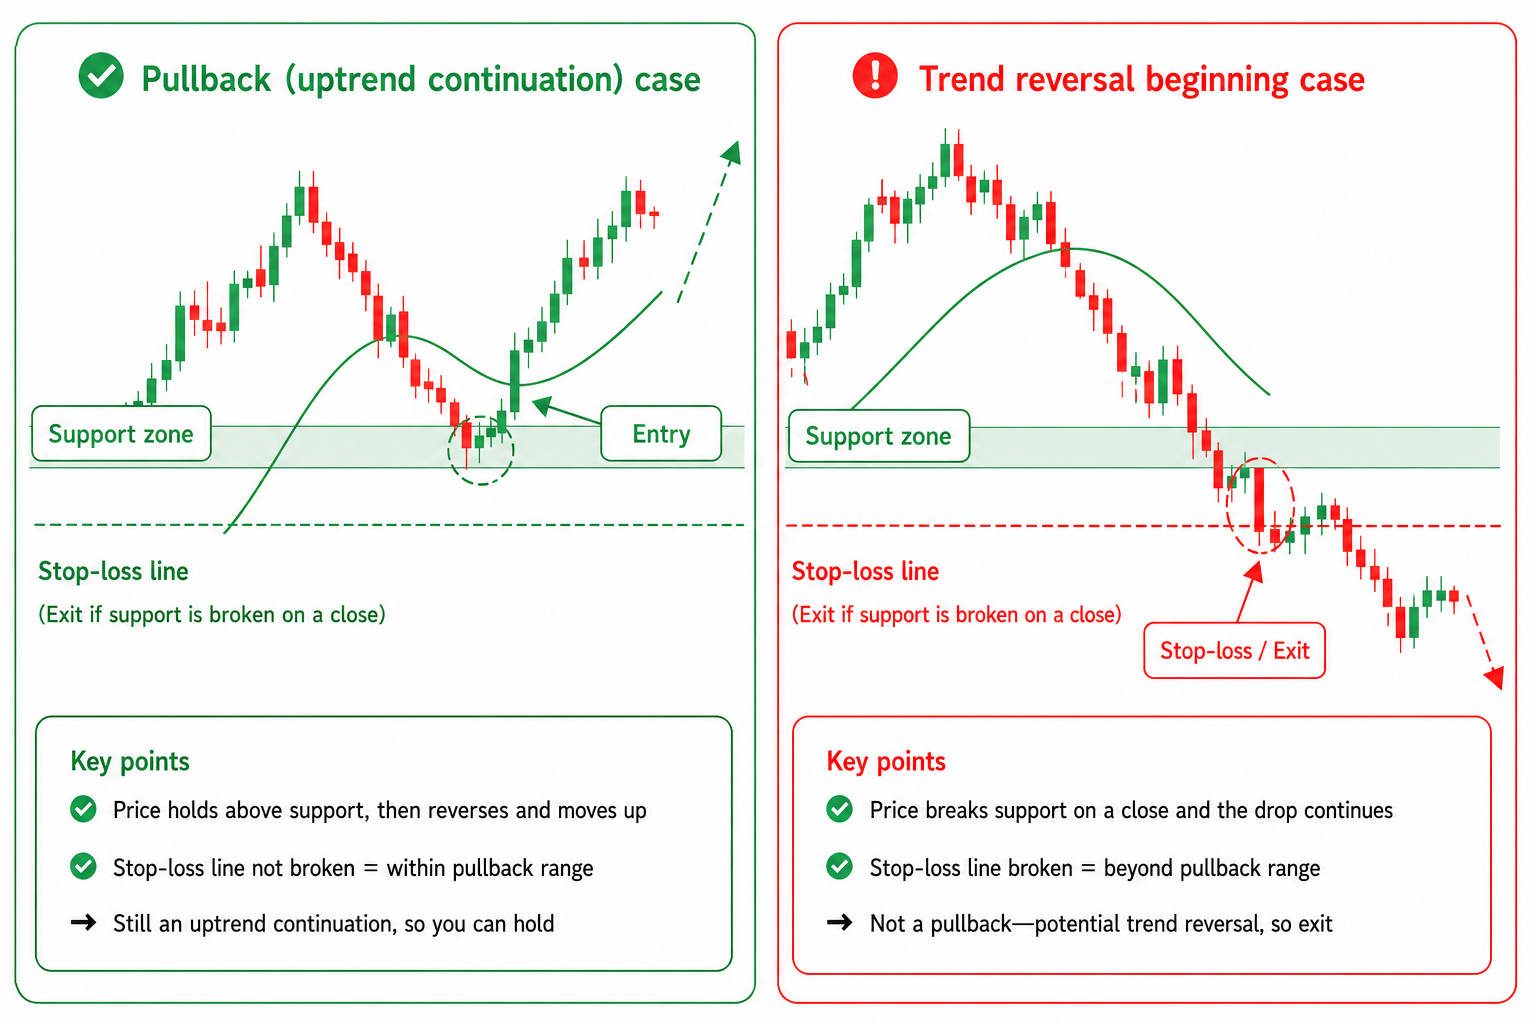
What helps here is tying your depth criterion to your stop-loss line. If you decide in advance the depth range you'll treat as a pullback — "if it closes below the prior low it's not a pullback," "if it breaks the support I was relying on, exit" — then any drop beyond that range can be exited mechanically as "possibly a reversal, not a pullback." Your depth criterion doesn't just set where you enter; it simultaneously sets where you decide "this wasn't a pullback" and cut.
The key is not to keep hanging on to a drop because you believe it's a pullback. Once the drop is past your depth criterion, your pullback thesis is invalidated — a sign to exit and reset. Building this distinction into a rule up front is the core of keeping losses small when trading pullbacks.
Why check it with backtesting
There's no fixed answer to "how deep a pullback do I wait for?" or "from where do I call it a reversal?" Even in the same uptrend, someone targeting shallow pullbacks and someone targeting deep pullbacks will enter a completely different number of times and in completely different places. Target shallow and you enter more often but also get stopped out more on continued drops; target deep and you get stopped out less but also miss more opportunities. Where in this balance fits your own instrument and timeframe is something you can only find by putting in the repetitions.
This is where chart replay (backtesting) comes in. You rewind a past uptrend and step forward one candle at a time, judging "do I buy the pullback here, or wait for more depth?" with the future hidden. Because it's virtual capital, there's no real loss risk, and you can compare "entering shallow" against "waiting for the deep entry" in the same situation. You can try, over and over, which depth criterion fits you.
Rule your entry and exit as a set
When thinking about pullback depth too, most stumbles come from deciding only the "conditions to enter" and entering without deciding the "conditions to exit." Since your depth criterion ties directly to the stop-loss line, always put entry and exit into words as a set.
Examples of entry (conditions to enter)
- What depth you'll treat as a pullback (prior low / MA / retracement percentage / support, etc.)
- Where in that depth you enter (enter on reaching the gauge, or enter after confirming a reversal signal)
- How you confirm the premise that the trend is still intact
Examples of exit (conditions to exit)
- Stop: the price at which you admit it wasn't a pullback (a close below the prior low or support, etc.)
- Take-profit: how far the recovery has to go before you lock in profit (the prior high / a fixed point move / take partial profit and let the rest run, etc.)
Tying your stop to your depth criterion — "if it closes below the support I was relying on, I judge it wasn't a pullback and exit" — makes the exit decision less prone to emotion. When the reason you entered (a bounce off the pullback) breaks down, you exit — deciding this correspondence up front is the core of building rules for dealing with depth.
Two example write-ups for the strategy-rules field
ENTRIQ's strategy tags include a field to record your strategy rules. Putting your own pullback-depth criteria into words there lets you check, every time you review, whether you entered at the depth your rule specifies. There are broadly two ways to write it. Neither is better — pick whichever makes it easier for you to reproduce your judgment.
Pattern A: Discretionary (define the situation in words)
A more discretionary style. You define context, entry, stop, exit, and stand-aside conditions in words, without pinning them to numbers.
Context: A clear uptrend where the moving average is pointing up and price is trading above it. Entry: Buy when price drops to a rising moving average or to a zone about as deep as the previous pullback, and a reversal candle prints. Stop: If price closes below the low or support I was relying on, judge it wasn't a pullback and exit. Exit: Consider taking profit once price recovers to just below the prior high. If the trend continues, take partial profit and let the rest run. Stand aside: Don't enter when the trend direction is unclear, or when the depth far exceeds the prior low and a reversal is in doubt.
Pattern B: Rules-based (spell the conditions out in numbers)
A more rule-based style. You fix the judgment with indicators and numbers so anyone reaches the same conclusion.
Context: 20-MA > 50-MA and the 50-MA is rising (treated as an uptrend). Entry condition: Buy when price retraces to (a set percentage) of the prior advance and the day's close confirms a bounce. Stop: Exit if the close is below the prior low (or −2%). Take-profit: Take profit on reaching the prior high − (a set amount). Filter: If the retracement exceeds (a set percentage) of the prior advance before the entry trigger fires, stand aside as the setup is outside valid pullback range.
Numbers make your review quantitative and easier to tally up. But the set percentages and the −2% written here are only "examples of how to write it" and do not guarantee their effectiveness or profitability. Confirm them for your own instrument and timeframe, and adjust while looking at the data.
The flow of backtesting and recording
Once you've put your rule into words, pick pullback situations in past uptrends on past charts and repeat virtual entries and exits with the future hidden. Each time, log "did I enter at the depth my rule specifies?" and "was it a pullback or a reversal?" in your trade journal and strategy tags.
One strategy tag per trade. Tagging them "pullback / MA bounce," "pullback / support," and so on lets you look across only the trades on the same depth criterion and check win rate, P/L, average risk-reward ratio, and more all at once afterward. Be sure to record the times you entered thinking it was a pullback and got stopped out on a reversal under the same tag.
One thing to watch here: while your sample is small, don't take the numbers at face value. Judging a depth criterion good or bad off 5 or 10 results is far too early. Build up your repeated practice with risk-free backtesting first, then look at the patterns.
The chart above is an illustration of how it might look. Even in the same uptrend, the result changes with how much depth you wait for and whether you confirm — checking that difference for yourself is the point of backtesting. Since waiting deeper also means missing more opportunities, look not just at win rate but at the number of trades and the size of the gains too.
You can also review the records you've accumulated with AI Analysis. AI Analysis organizes into words the recurring patterns observed in your past trade data and notes. It's a way to surface behavior that's hard to spot yourself, like "the shallower the pullback I entered, the more records I have of getting stopped out on a continued drop" (it is not a buy/sell signal or recommendation).
Four common mistakes
- Jumping into a shallow pullback: Enter after only a small drop and the real pullback may be much lower, dragging you into a continued drop. Decide your own depth criterion and wait for it.
- Entering without tying the stop to your depth criterion: What you think is a pullback can be a reversal. Enter without tying your exit line to the prior low or support, and the loss balloons when it turns out to be a reversal.
- Hanging on because you believe it's a pullback: Hold past your depth criterion thinking "it'll come back," and you take the reversal drop head-on. Once it's past your criterion, judge that the pullback thesis was wrong.
- Not recording the one time you got stopped out on a reversal: The times a pullback paid off stick in memory, but the times you got stopped out on a reversal are the ones worth reviewing. Record the failures under the same strategy tag too.
FAQ
Q. Should I pick the "shallow" or the "deep" pullback? A. Neither is better. A shallow pullback gets you on the trend early but is easier to get caught in a continued drop; a deep pullback tends to be favorable on price but you may not make the bounce in time. Using prior lows, moving averages, retracement percentage, and support as gauges, decide how far you'll treat as a pullback, then compare shallow and deep versions in your own records and judge by which is easier to reproduce as your own rule.
Q. How can I tell a pullback from a trend reversal? A. There's no way to tell for sure while price is falling. That's exactly why you decide the depth criterion in advance — "if it closes below the prior low or support, it's not a pullback, exit." Treating any drop past your criterion as a sign the pullback thesis was wrong and exiting mechanically keeps the loss small when it turns out to be a reversal.
Q. I often wait too long and miss the entry. What should I do? A. The deeper you wait, the more often price bounces and you miss the opportunity. This is the flip side of "waiting deeper to reduce fakeouts." Whether to enter shallow and take the continued-drop risk, or wait deep and take the missed-opportunity risk, depends on which fits your instrument and timeframe — decide it after comparing both in your records. Setting an upper limit on how deep you'll wait (a line where, if it doesn't retrace this far, you stand aside) also helps prevent waiting too long.
Q. Moving average or Fibonacci — which should I use as my depth gauge? A. Neither is better. The MA is a gauge that moves with the trend; Fibonacci (the retracement percentage) is a gauge based on the ratio to the up-move — the focus is different. Display both and compare which works better for your instrument on past charts. The more your gauges overlap in a price zone, the stronger the case for the pullback.
Q. Which instruments can I use to practice pullback depth? A. ENTRIQ's backtesting supports US stocks, forex, commodities, and crypto. Japanese stocks are planned for a future release. You can also view multiple timeframes at once while you test, so it works for practice like confirming trend direction on a higher timeframe while measuring pullback depth on a lower one.
While a pullback is falling, you can't tell whether it's the bottom. Whether you can respond and keep losses small comes down to your criterion for how far you'll treat as a pullback, and the stop for when that criterion is breached. Write your depth criterion and your exit into the strategy-rules field as a set, and check them over and over on past charts.
The overall flow of buying pullbacks and selling rallies — and the backtesting steps — is covered systematically in the parent article, Pullback Trading Strategy: Buy the Dip, Backtest Your Rules. Use it together with the depth criteria in this article.
ENTRIQ is a stock practice and backtesting tool for individual traders that brings chart replay, trade journaling, and AI Analysis together.
This article does not guarantee the effectiveness or profitability of any specific method or rule. The figures and examples given are samples to illustrate how to write the rules, and do not represent investment results. Make your own investment decisions at your own responsibility.
Reproduce this validation yourself
With ENTRIQ's chart replay, you can trade through past charts using the same rules.
Start 14-day free trialValidate your method on past charts
The same validation in this article can be reproduced with your own method. On past charts, do the classics really work?
- ✓ Replay past charts
- ✓ AI feedback on your trades
- ✓ Validate methods with statistics