How to Spot a False Breakout (Fakeout) and Backtest It
How to spot false breakouts (fakeouts): use close confirmation, retests, and backtesting to decide how much confirmation you need before entering.
You think a resistance level has finally broken, so you jump in — and price snaps right back inside the level and stops you out. Anyone who trades breakouts has probably been caught by this more than once. One of the biggest challenges in breakout trading is exactly this: the false breakout, often called a fakeout. If you trade breakouts, learning how to deal with moves that break a level and quickly reverse is essential.
This article zooms in on one thing from the broader breakout trading strategy: how to filter out fakeouts. We'll walk through what a fakeout is, where it tends to happen, how to reduce it, and how to write your own rules for it in ENTRIQ's strategy rule field (with two example formats).
You can't avoid fakeouts entirely when you trade breakouts. What matters isn't eliminating them — it's deciding for yourself how much confirmation you require before you treat a breakout as valid, and then replaying past charts to check that decision again and again.
What Is a False Breakout (Fakeout)?
A fakeout is when price appears to break a level — a resistance or support level, the edge of a range — and then quickly slips back inside. It's also called a false breakout or failed breakout. The classic case: you buy because price cleared overhead resistance, and moments later it drops back below and falls. Because the trade thesis depends on price holding beyond the level, a failed breakout can quickly trigger a stop-loss.
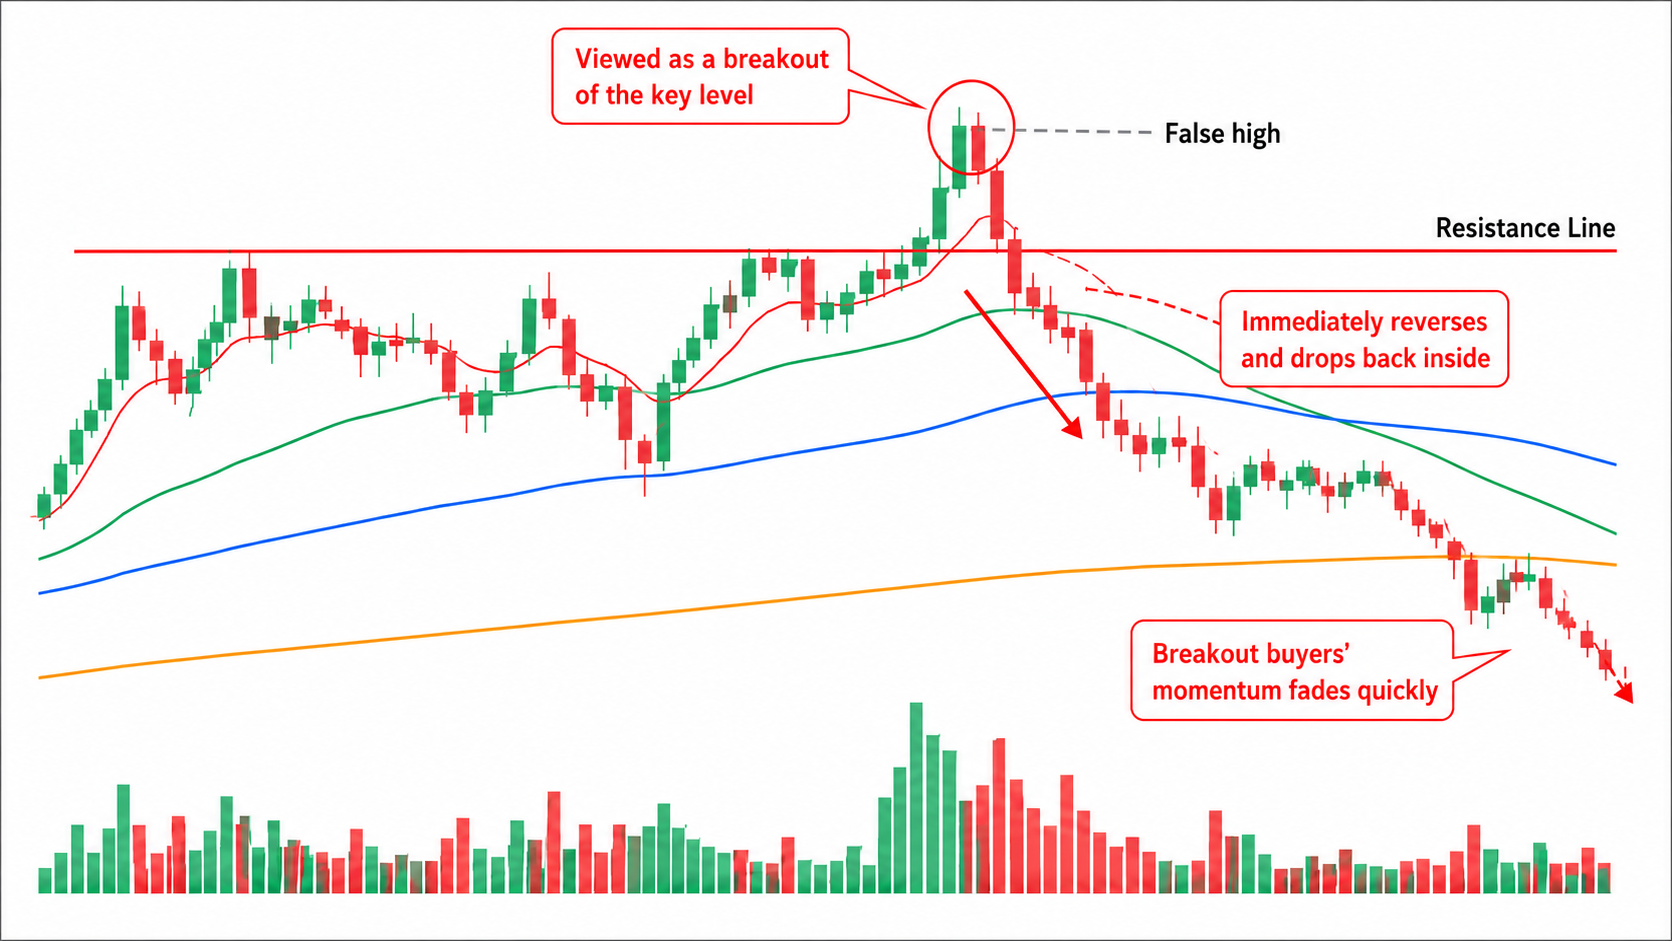
Why do fakeouts happen? One reason: the breakout fails to attract enough follow-through buying, momentum fades, and price rolls back. Another: price runs into a concentration of opposing orders just beyond the level and reverses. Either way, the shared point is that the fact of a break alone doesn't decide whether the move continues.
The hard part of a fakeout is that at the moment of the break, you can't tell whether it's real or false. Look back at the chart later and "this was a fakeout" is obvious; in the moment it isn't. The goal isn't to see through every fakeout perfectly — it's to decide how much confirmation you require before treating a breakout as valid, and to learn from backtesting how well that confirmation has held up.
Where Fakeouts Tend to Happen
Fakeouts are said to happen more often in a handful of situations. Rather than calling any of these "the answer," here's a neutral list of the commonly cited ones. Backtesting can help you determine which factors matter most for the market and timeframe you trade.
| Scenario | Why it happens | The trap |
|---|---|---|
| A breakout on weak volume | If volume doesn't rise on the break, momentum tends not to last | Volume norms differ by symbol and market |
| Around news and events | A temporary move around a release can clear a level and snap back | You get caught if you don't track the calendar |
| Just below or above a higher-timeframe level | A lower-timeframe break can be turned back by a big level above | Hard to notice from your own timeframe alone |
| A small break inside a range | Barely clearing the edge of a tight range tends to fall back in | A tight range has little room to run even on a valid break |
| A wick-only break | If the close comes back inside, the break was likely temporary | Judging on the wick gets you whipsawed |
Let's look at each one a little more closely.
A breakout on weak volume
When price clears a level but volume (how active the buying and selling is) doesn't rise, the breakout tends to lack follow-through. If many participants had recognized the break and placed orders, volume should climb; a breakout without it may have cleared the level on only a slice of activity. Adding volume to your checklist helps you filter for breakouts that have some backing behind them.
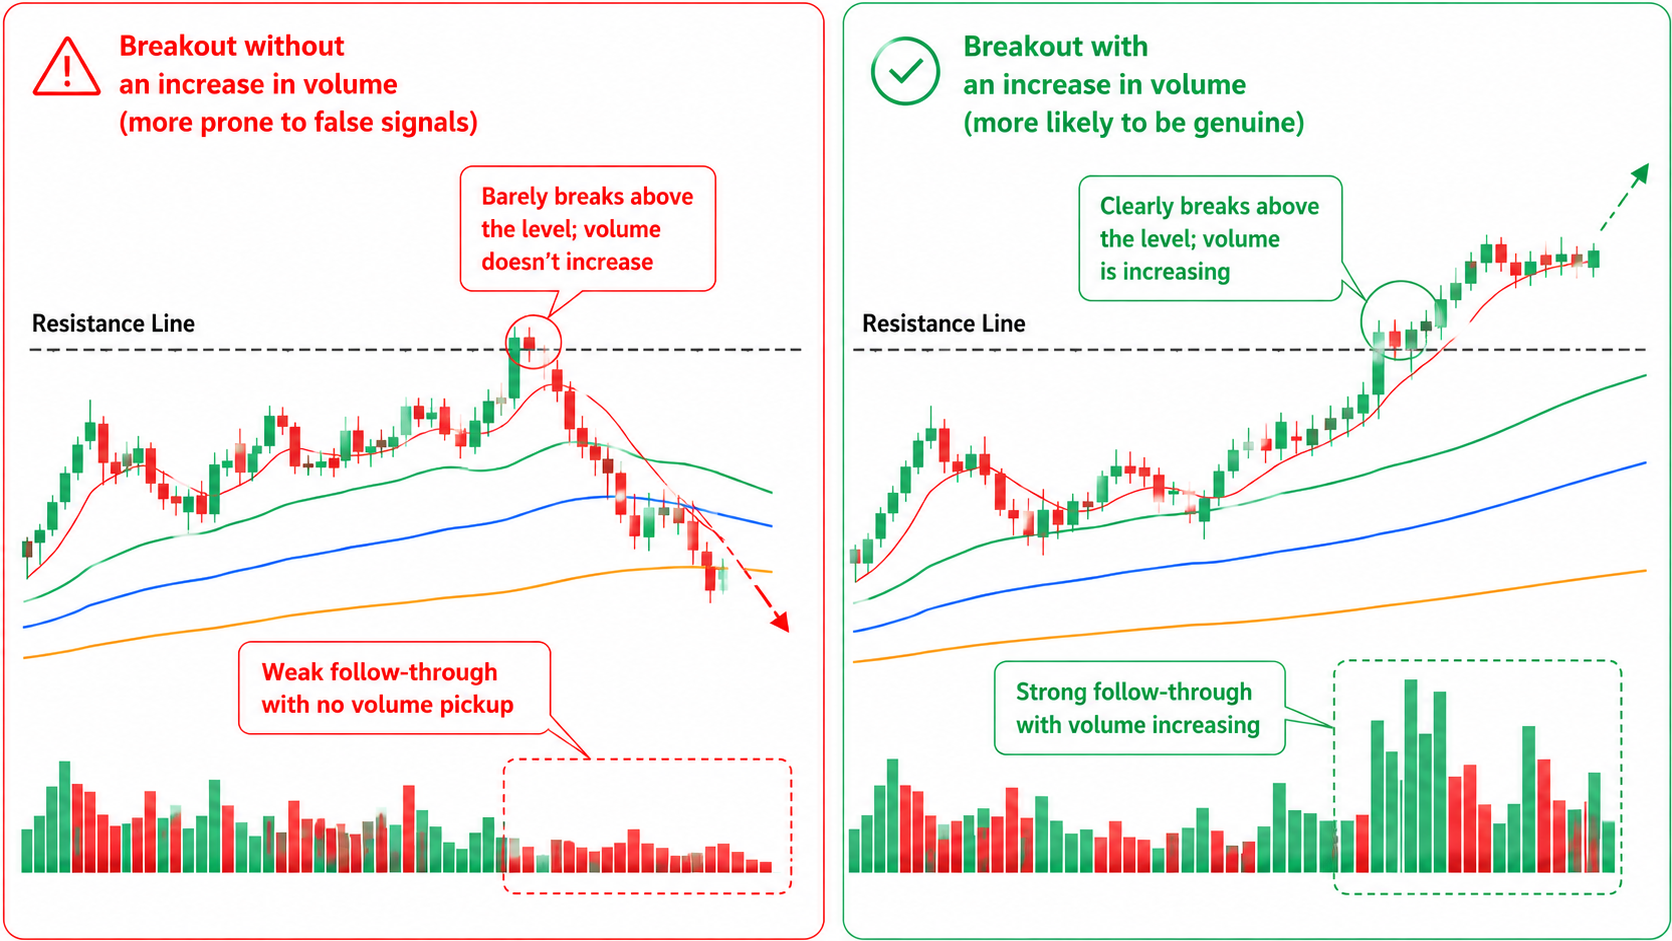
The catch is that volume norms shift by symbol and market. What counts as "a rise" differs between a heavily traded name and a thin one, and some markets like FX make volume itself hard to read. If you use volume, you need to decide through backtesting how much of an increase counts as confirmation for your symbol and market.
Around news and events
Around economic releases, earnings, and other events that move markets sharply, a temporary move can clear a level and snap right back. Price may briefly break a key level immediately after an economic release, only to reverse within minutes, and that's hard to tell from a valid breakout.
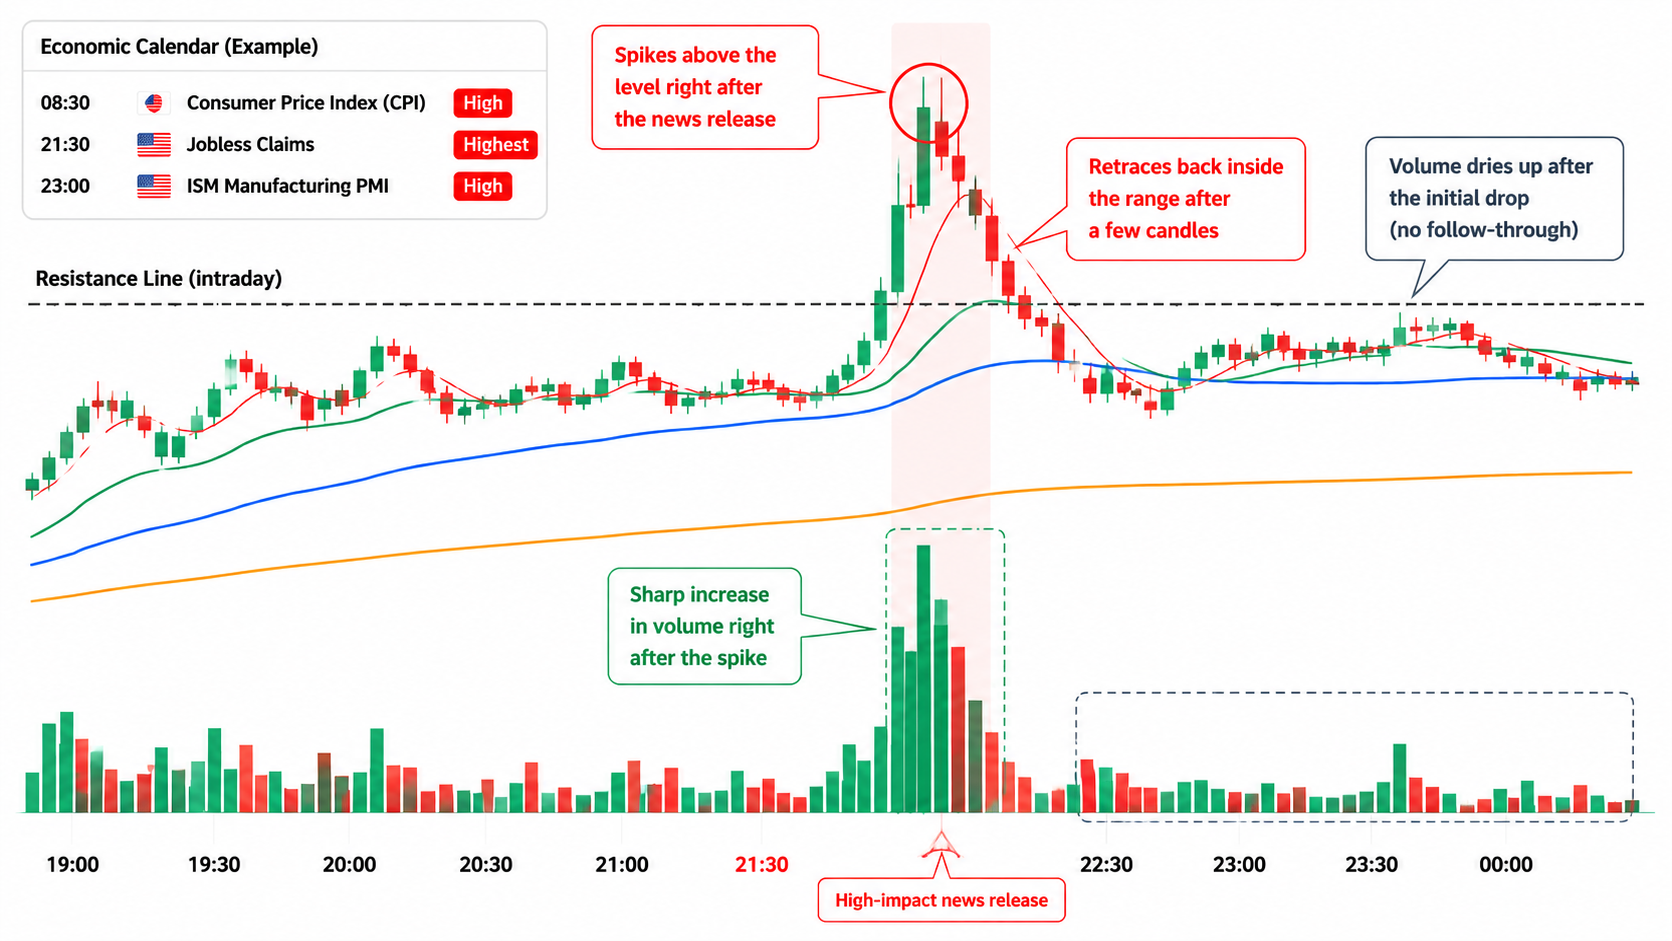
The catch is that you get caught if you don't track the calendar. Whenever you wonder why price broke and immediately reversed, a scheduled release is often the culprit. If you want to avoid events, checking the key calendar for your symbol and market ahead of time and standing aside around it is the kind of prep that pays off.
Just below or above a higher-timeframe level
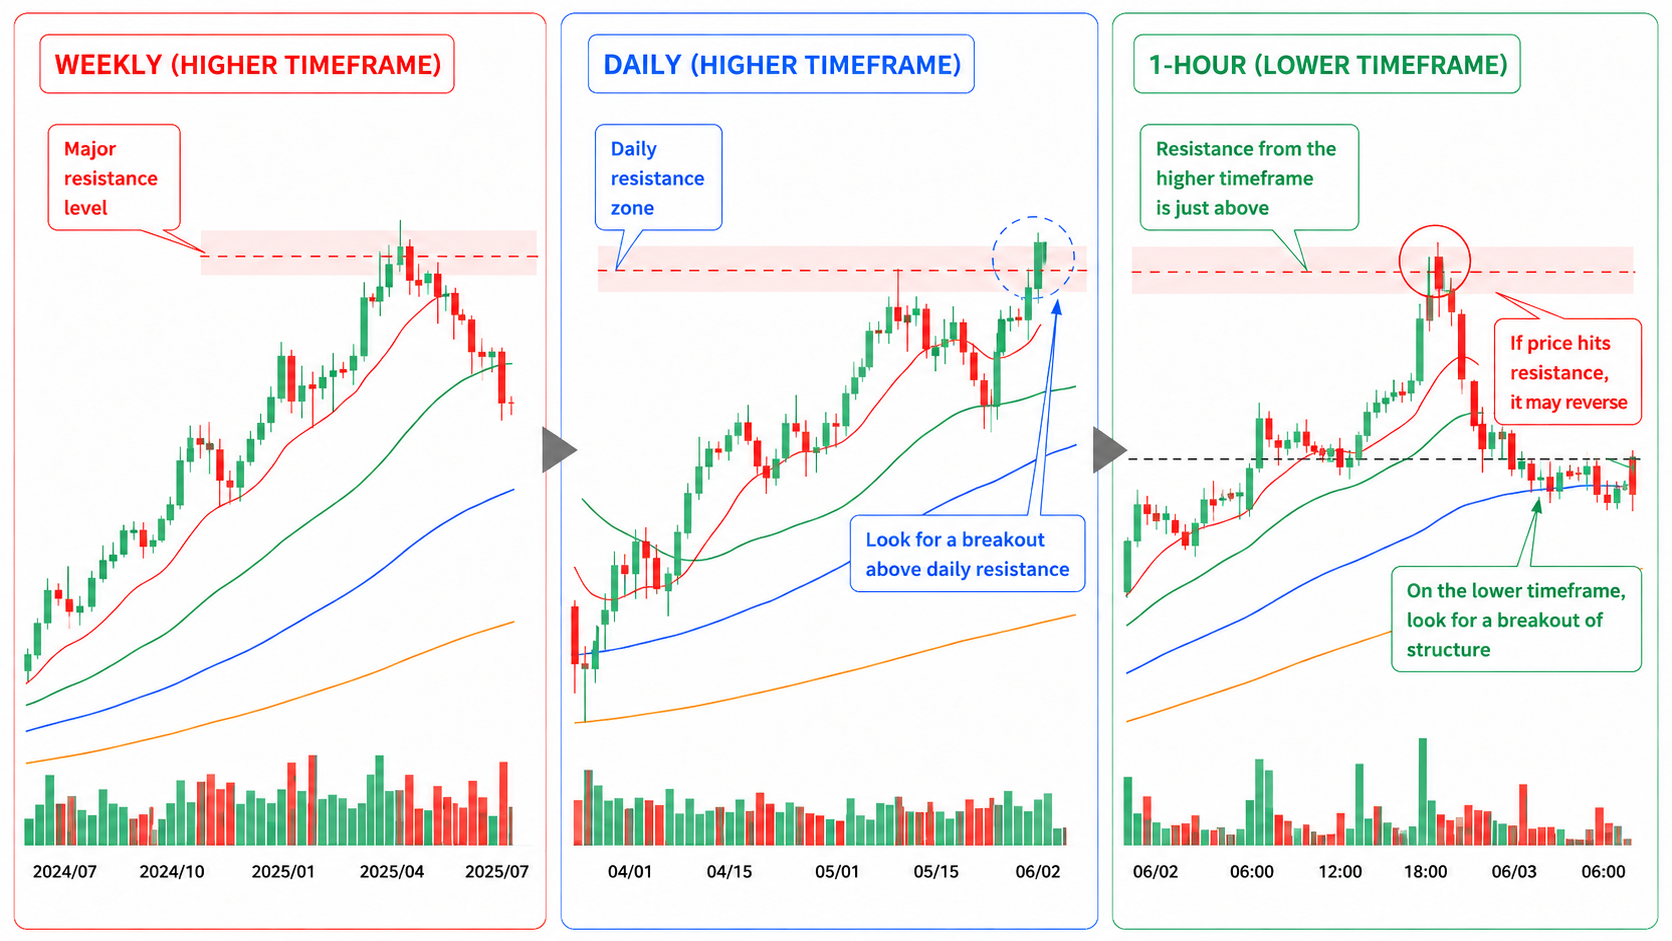
Even when a level looks broken on the timeframe you're watching (the lower timeframe), a large resistance or support waiting on a higher timeframe can turn price back. For example, a break of the highs on the 1-hour chart that's sitting just under strong daily resistance. A daily break can turn out to be right in front of major weekly resistance. Watching only the lower timeframe, you miss this overhead wall.
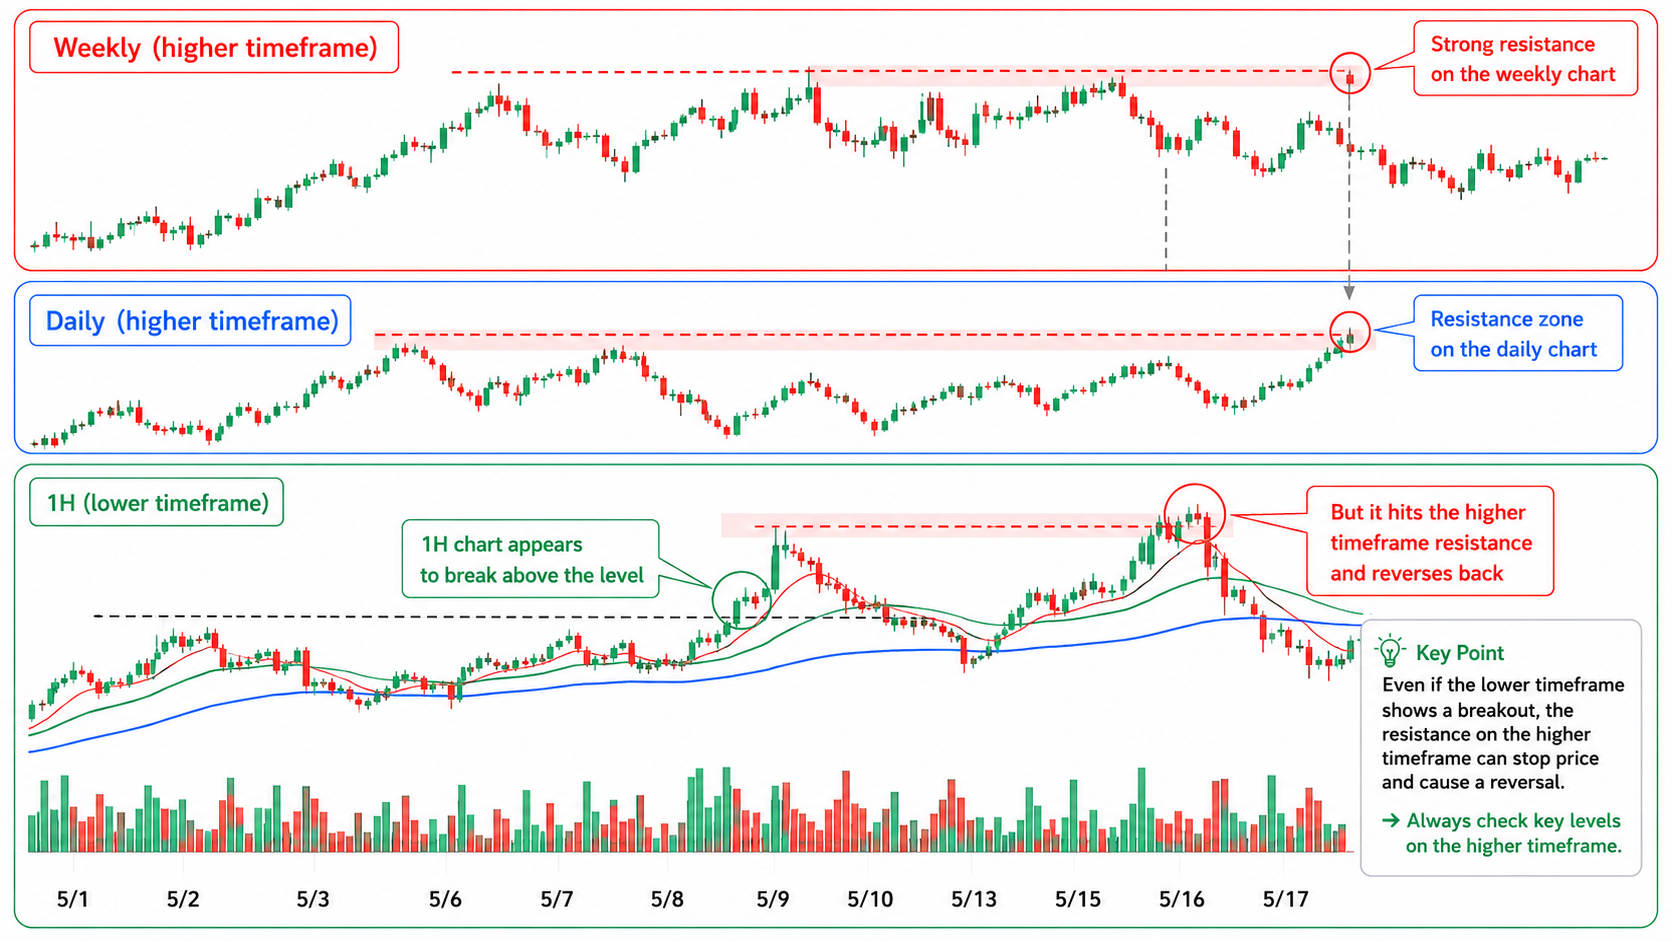
The catch is that it's hard to notice from your own timeframe alone. Checking the big higher-timeframe levels before you go for a breakout helps you avoid breakouts that run directly into higher-timeframe resistance. Moving between several timeframes to read the backdrop is effective prep for cutting down fakeouts.
A small break inside a range
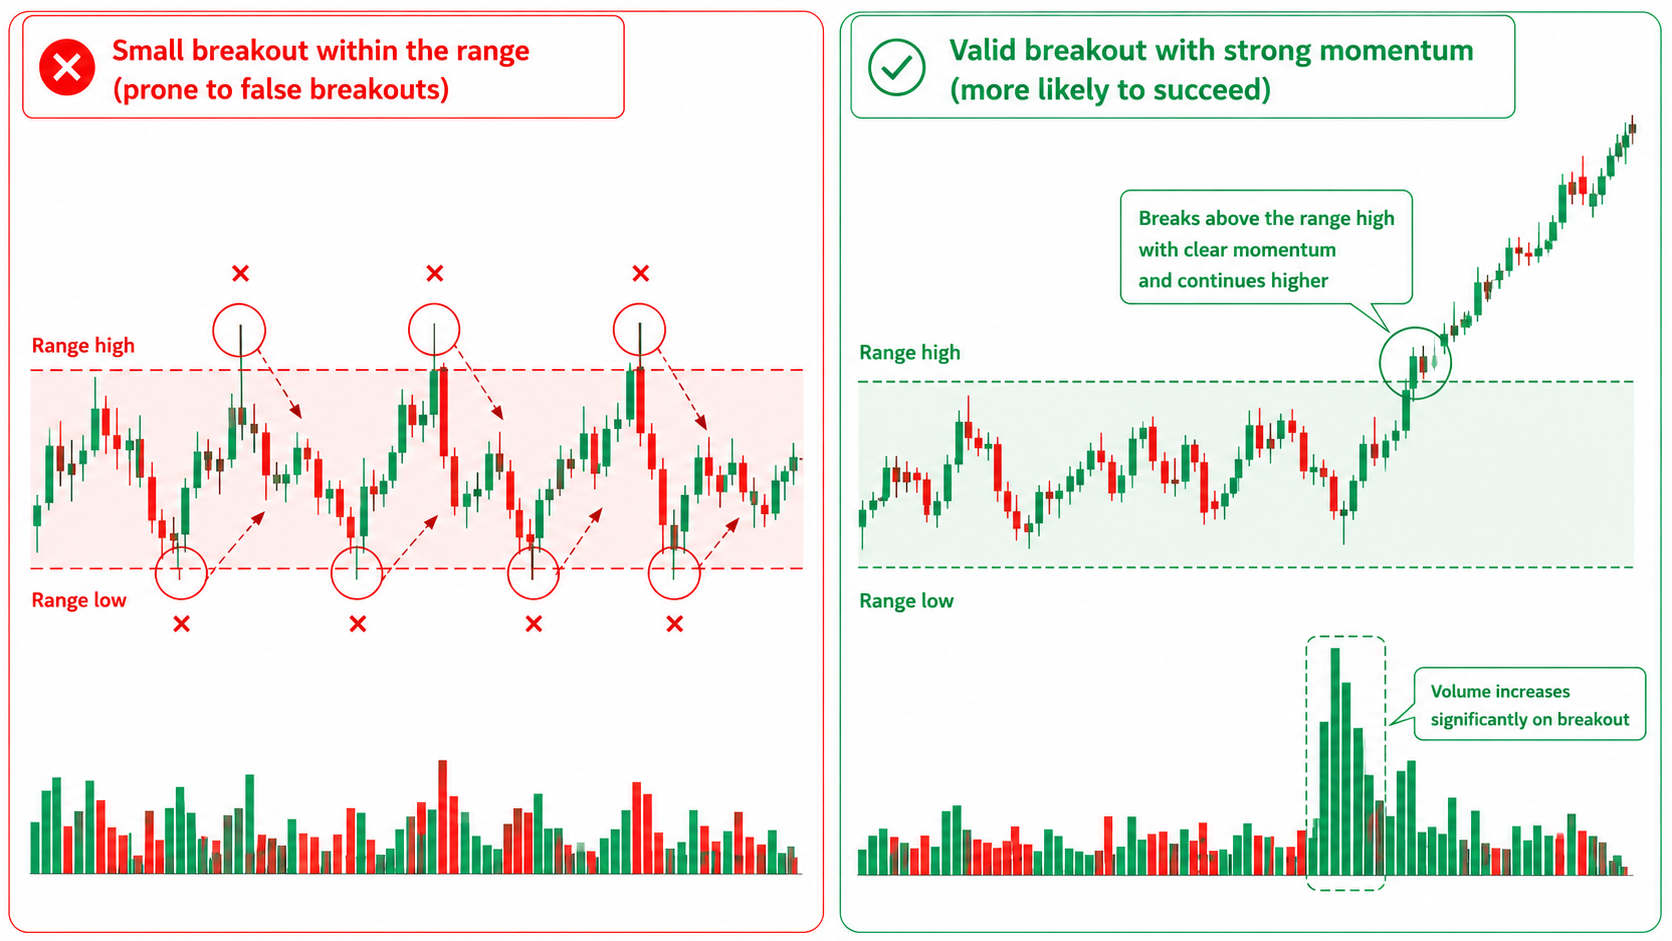
When price barely clears the edge of a tight range (a consolidation), it often falls back into the range instead of developing into a sustained move. Inside a narrow range, small pushes past the edge happen repeatedly — mostly noise — and most come back in rather than becoming a valid breakout. React to every small break and you may suffer repeated stop-outs as price moves back and forth across the range boundary.
The catch here is that a tight range has little room to run even on a valid break. Even if the break is genuine, the available move is small, and if price comes back into the range it easily turns into a fakeout — that thin payoff is the range-specific issue. How you handle the edges of a range connects to drawing the top and bottom, covered in range trading.
A wick-only break
When only the candle's wick (the line extending above or below) clears the level while the body (the range between open and close) stays inside, the break was likely temporary. If the candle closes back inside the level, you read it as "broke, but couldn't hold." Confirming the break on the close is the basic way to avoid wick-only fakeouts.
The catch is that judging on the wick gets you whipsawed. Enter the instant a wick pokes through and you get pushed back on the close into a fakeout — that pattern shows up constantly. On the other hand, waiting for the close delays your decision. This "wick or close" line is the center of the next section, on reducing fakeouts.
How to Reduce Fakeouts
The two main ways to reduce fakeouts are confirming on the close and waiting for a retest.
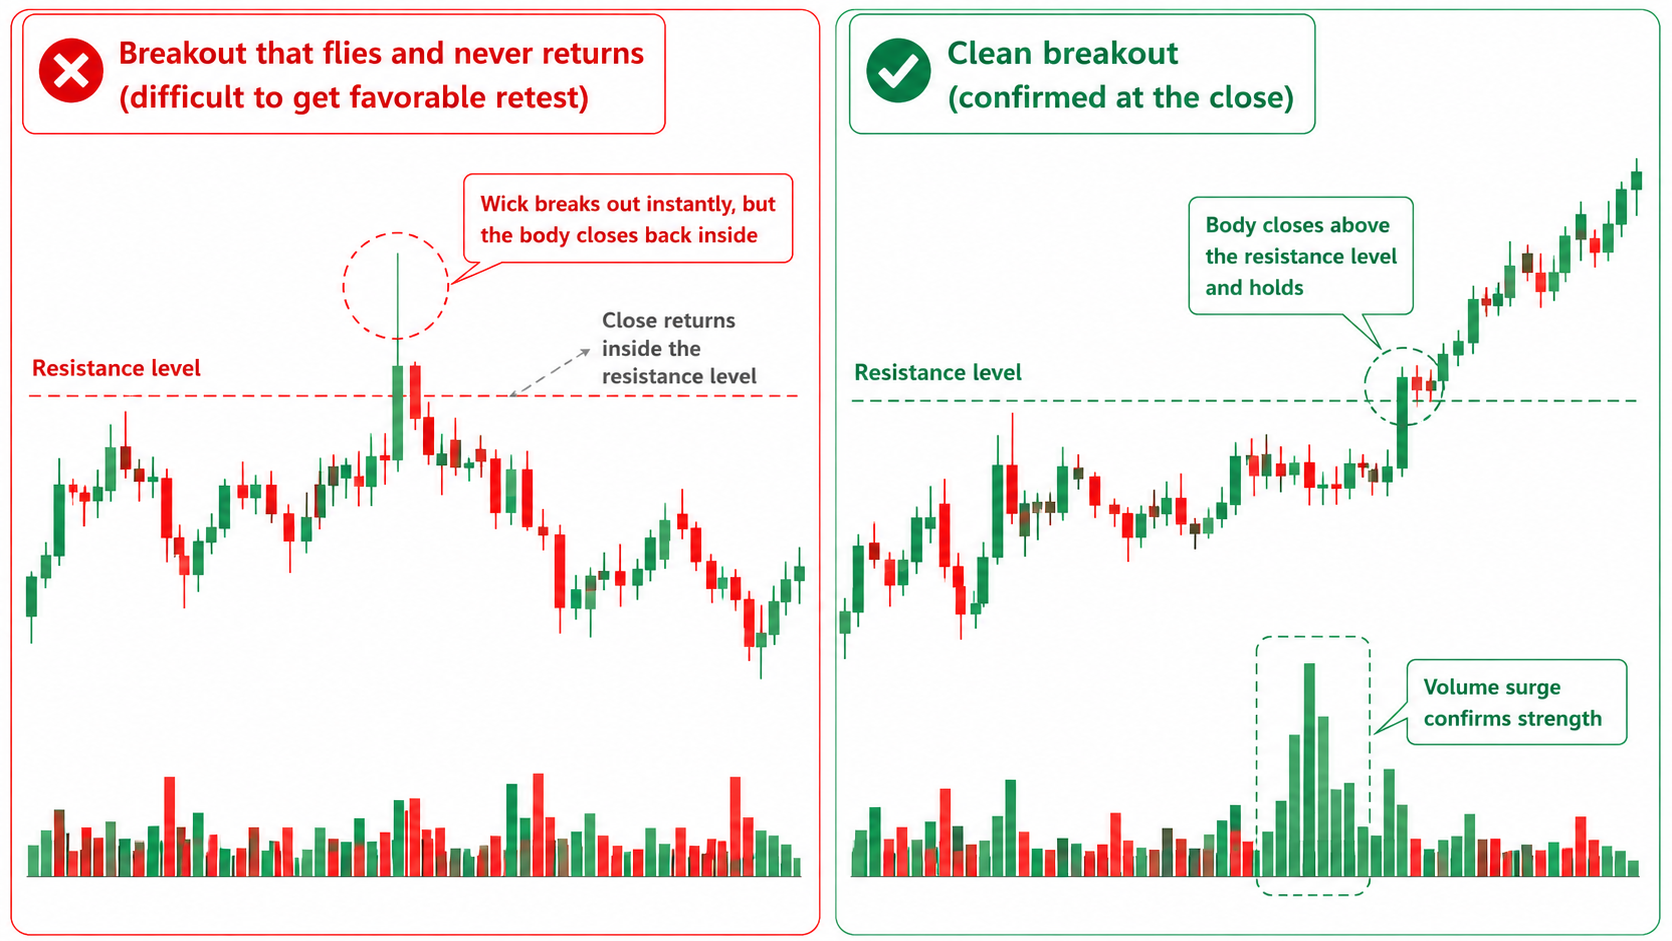
Close confirmation means checking whether the candle actually closes beyond the level. Even if a wick clears it for a moment, if the close comes back inside you don't treat it as a valid break. That alone avoids many wick-only fakeouts.
Waiting for a retest means holding off until price comes back to the level and tests it from the other side — a so-called role reversal, or SR flip. If the old resistance holds as new support, this can provide additional confirmation that the breakout is holding.
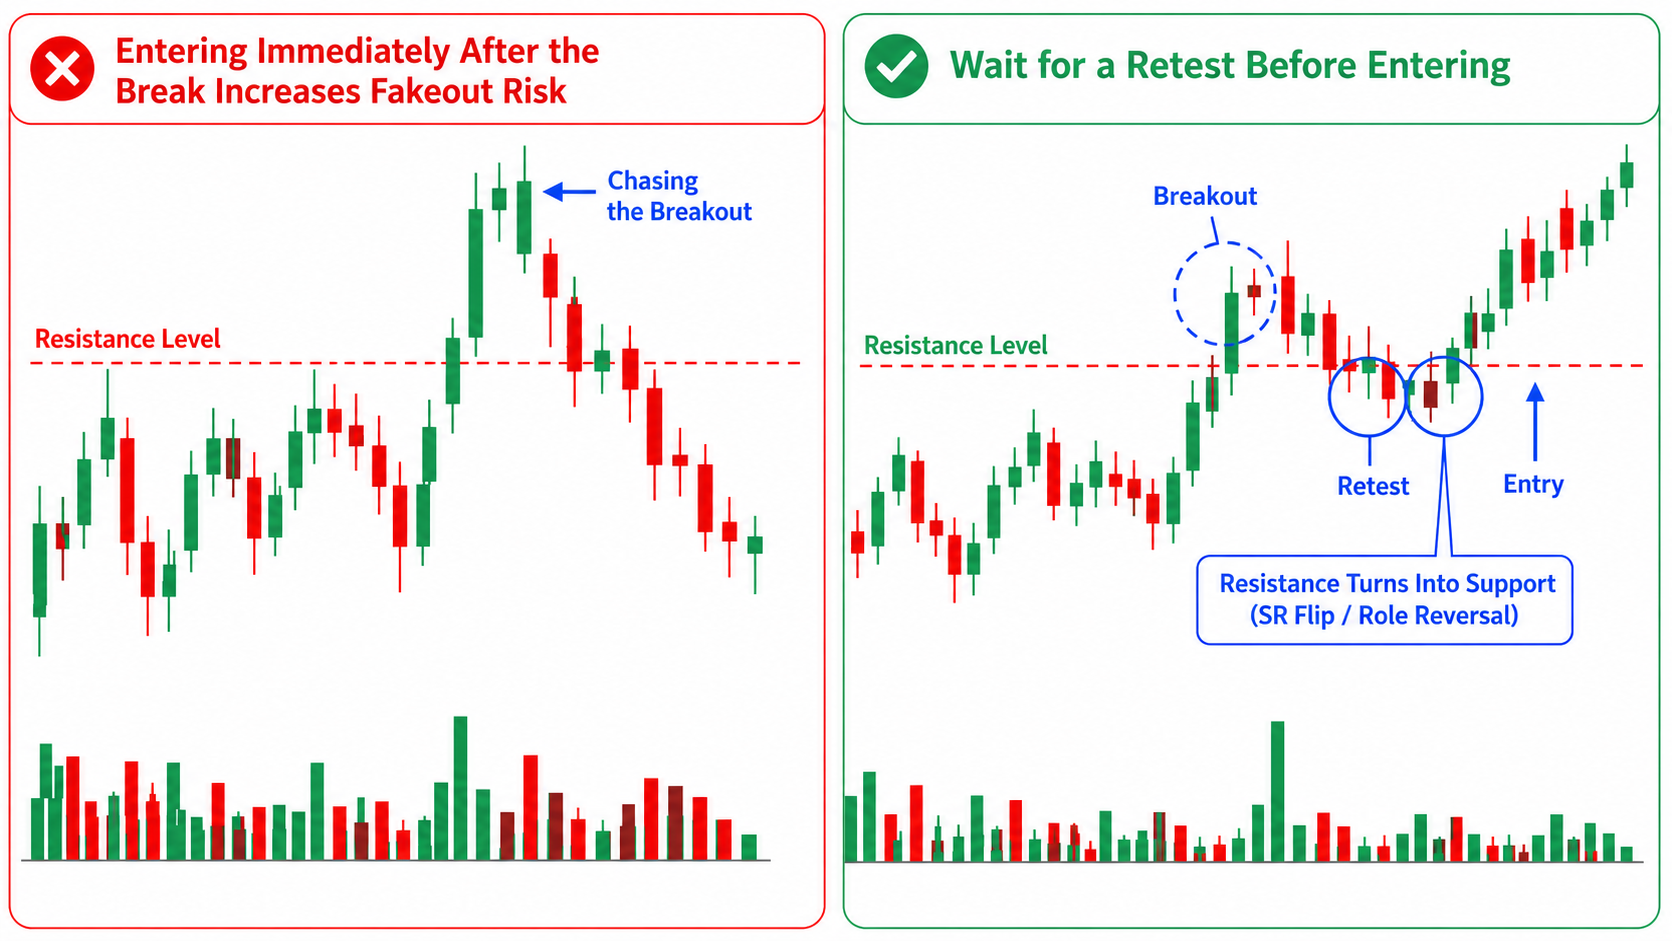
That said, the more you confirm, the fewer fakeouts — but the later your entry, and the less of the initial move you capture. It's the classic trade-off: an aggressive entry gets you a better fill but takes on more fakeout risk, while a conservative entry waits for confirmation and captures less of the initial move. Neither is better than the other; it comes down to whether it fits your symbol and timeframe. The better approach can't be settled in theory — it has to be tested on historical data.
Why Backtesting Matters
There's no single right answer to how much confirmation you should require before treating a breakout as valid. Some traders enter only after a close confirms; others go for the initial move without waiting for a retest. This article doesn't push one approach — it lays out a way to compare how much confirmation suits you. For the same break, someone entering on the wick, someone waiting for the close, and someone waiting for a retest all differ completely in how often and where they enter. Require more confirmation and fakeouts drop but missed moves rise; require less and you miss fewer but take more fakeouts. The right balance depends on your market, timeframe, and trading style, and can only be assessed through repeated testing.
This is where chart replay (backtesting) comes in. You rewind past charts to a spot where a level breaks and step through the candles one at a time, deciding "enter here / wait for the close / wait for the retest" with the future hidden. Because it's virtual capital, there's no real downside risk, and you can compare entering on the wick against confirming on the close on the very same break. Repeated testing helps you become more consistent in applying your confirmation rules.
Define Entry and Exit Rules Together
When you work on fakeouts too, most of the trouble comes from setting only your entry condition and getting in without setting an exit. Because a fakeout ties directly to your stop, always put your entry and exit into words as a pair.
Entry (conditions to get in), for example
- Which level's breakout you target (resistance level / range high / prior high, etc.)
- How you confirm the breakout (a confirmed close beyond the level / a successful retest)
- Prep to avoid fakeouts (volume, higher-timeframe resistance, whether an event is due)
Exit (conditions to get out), for example
- Stop-loss (invalidation): the price level at which you treat the breakout as failed (a close back on the wrong side of the level, etc.)
- Target: how far it has to move before you exit (next level / a set distance / scale out part and let the rest run)
Tie your stop to the level — "if a candle closes back through the broken level, treat it as a fakeout and exit" — and the exit decision leans less on emotion. When the reason you entered (a valid breakout) is invalidated, you exit. Defining this relationship in advance is central to building a consistent breakout strategy.
Strategy Rule Field: Two Examples
ENTRIQ's strategy tags include a strategy rule field to write down your approach. Put your own fakeout rules into words there, and each time you backtest you can look back at whether you required confirmation before entering, as your rule says. There are broadly two ways to write it. Neither is superior; pick whichever makes your judgment easier to reproduce.
Pattern A: Discretionary (define the situation in words)
This format is suited to discretionary traders: you define the setup in qualitative rather than numerical terms — context, entry, stop, exit, and stand-aside conditions.
Market structure / context: A resistance level that has turned price back several times at recent highs, with no large higher-timeframe resistance sitting just above it. No major economic releases or company-specific events scheduled around the entry. Entry: If price closes clearly beyond the resistance level and holds on a retest, buy. Stop (invalidation): If a candle closes back below the broken resistance level, treat it as a fakeout and exit. Exit: Consider taking profits at the next level. If momentum continues, scale out part and let the rest run. Stand aside: Don't enter on a breakout with weak volume, just below higher-timeframe resistance, or around a release.
Pattern B: Rules-based (spell out conditions with numbers)
A rule-based format. You fix judgment to indicators and numbers so anyone reading it reaches the same conclusion.
Setup criteria: A breakout above the highest high of the last 20 bars. Same-day volume at least 1.5× the recent 5-day average. Trigger: Buy when the day's close is at least 0.5% above the resistance level. Stop: Exit if the close drops below the resistance level (or the level −2%). Target: Take profits slightly below the next resistance level (about −0.3%). Filter: If same-day volume is under 1.5× the recent 5-day average, stand aside.
Putting it in numbers makes your review quantitative and easier to tally afterward. That said, the 20 bars, 1.5×, 0.5%, and −2% here are examples of how numerical rules can be written; they are not recommended settings and don't guarantee effectiveness or profits. Backtest on your own symbol and timeframe, and adjust as you watch the data.
Test and Record
Once your rules are in words, pick spots where a level breaks on past charts, and run virtual entries and exits with the future hidden. Each time, record in your trade journal and strategy tags whether you required confirmation before entering as your rule says, and whether it was a valid breakout or a fakeout.
Assign one strategy tag to each trade. Tag them like "Breakout – close confirmation" or "Breakout – retest," and you can pull just the trades that used the same confirmation method and compare their win rate, total P/L, average risk-reward ratio, and other metrics as a group. Always record the times a fakeout stopped you out under the same tag.
One thing to watch: don't take the numbers at face value while your sample is small. Deciding whether a confirmation method is good on 5 or 10 results is too early. Build up your repetitions on risk-free backtesting first, then look at the patterns.
The chart above uses hypothetical data to illustrate how results may differ across confirmation methods (not real data). For the same break, changing how much confirmation you require changes the outcome — confirming that difference for yourself is the point of backtesting. Because more confirmation also means missing more, look at win rate alongside the number of trades and the size of the moves.
Records you build up can also be reviewed with AI analysis. AI analysis doesn't tell you what to buy or sell; it organizes patterns observed in your past trade data and notes into words. It can help surface patterns that may be difficult to notice through manual review alone — for example, that trades entered on wick-only breaks were stopped out more often.
Four Common Mistakes
- Entering on a wick break: Enter on a momentary poke-through and you get pushed back on the close into a fakeout. Define your confirmation rule in advance — for example, requiring a close beyond the level — and wait for it.
- Entering without tying your stop to the level: Fakeouts come with the territory on breakouts. Get in without tying your exit to the broken level and losses balloon when it turns out to be a fakeout.
- Entering without checking higher timeframes or events: Jump in without noticing overhead resistance or a release and you get knocked back. Check the backdrop and the calendar before you go for a breakout.
- Not recording the fakeouts: The trades that worked out on valid breaks stick in memory, but the fakeout losses are the ones worth reviewing. Record the misses under the same strategy tag too.
FAQ
Q. Is there a way to filter out every fakeout?
A. No. Confirming on the close, waiting for a retest, checking volume and higher timeframes — these reduce fakeouts, but each delays your entry and captures less of the move. Fakeout risk and upside are a trade-off, so the realistic path is to confirm through backtesting which balance fits you.
Q. If I confirm on the close, can I avoid fakeouts?
A. It avoids many wick-only fakeouts, but price can also reverse after closing beyond the level. Close confirmation is one effective tweak, not a cure-all. It's worth adding a retest or a higher-timeframe check on top of it and using backtesting to learn how well it works for your own symbols.
Q. Won't waiting for a retest make me miss the breakout?
A. Waiting for a retest does capture less of the initial move. In exchange, you take fewer fakeouts. Chasing the initial move and taking fakeout risk versus waiting for a retest and capturing less is a trade-off. The most reliable way to determine which fits your market and timeframe is to compare both through backtesting.
Q. What if it runs without ever giving a retest?
A. If your rule requires a retest and no retest occurs, you skip the trade. You'll miss more, but in exchange you take fewer fakeouts. Changing your rule midway breaks consistency with your test results, so when in doubt, favor the rule. Record the trades you skipped too, and you can review later whether waiting for a retest is a design that fits you.
Q. Can I check volume in every market?
A. Stocks make volume easy to read, but some markets like FX make volume itself hard to get. When volume is hard to use, you can rely more heavily on price-based confirmation — the close, retests, and higher-timeframe levels. Which inputs help depends on the market, so confirm it in backtesting.
Q. Which symbols can I test fakeouts on?
A. ENTRIQ supports backtesting across US stocks, FX, commodities, and crypto. Japanese stocks are planned for a future release. You can also review several timeframes at once, so it's useful for practicing how to filter false breakouts — going for a breakout on the lower timeframe while checking higher-timeframe resistance.
With a breakout fakeout, you can't tell in the moment whether the break is real or false. How it turns out over time depends heavily on where you draw the line — how much confirmation you require before entering — and on your exit rule when it is a fakeout. Write your confirmation method and your exit into the strategy rule field as a pair, and replay past charts to check them again and again.
For a broader overview, see our guide to the full breakout trading strategy.
ENTRIQ is a stock practice and backtesting tool for individual traders that brings chart replay, trade journaling, and AI analysis together.
This article does not guarantee the effectiveness or profitability of any specific method or rule. The numbers and examples shown are samples to illustrate how to write, not indications of investment results. This content is for educational purposes only and is not investment advice; all trading and investment decisions are made at your own risk.
Reproduce this validation yourself
With ENTRIQ's chart replay, you can trade through past charts using the same rules.
Start 14-day free trialValidate your method on past charts
The same validation in this article can be reproduced with your own method. On past charts, do the classics really work?
- ✓ Replay past charts
- ✓ AI feedback on your trades
- ✓ Validate methods with statistics