Golden Cross & Death Cross: Backtest Your MA Signals
Golden cross and death cross signals lag and produce plenty of fakeouts. Here's why, and how to backtest your own crossover rules in ENTRIQ's chart replay.
Golden Cross & Death Cross: Backtest Your MA Signals
"I bought the golden cross, and that turned out to be the top." If you've ever traded with moving averages, you've probably felt this at least once. The crossover is a staple that shows up in every textbook, but the moment you use it on your own chart you run into two walls: it's "too slow," and it throws "one false signal after another."
That doesn't mean the crossover is useless. In most cases, the real problem is that you haven't decided where on the cross to act, or in what kind of market to trust it. This article works through three things in order:
- Why golden and death crosses lag, and the conditions where false signals pile up
- Five lenses that turn a cross from a "signal" into a "starting point for confirmation"
- How to backtest and rule-ify your own crossover decisions in ENTRIQ's chart replay
This is the detailed companion to the overview article on moving averages themselves (slope, crossovers, and reactions — the three ways to use them): Moving Average Strategy: Slope, Crossovers, and Backtesting. If you're new to moving averages, read the overview first and then come back here; the flow will be easier to follow.
The bottom line first: a cross is a starting point, not a signal
Let me put the one idea this whole article is built on right up front.
A golden cross or death cross isn't a signal that decides a trade on its own. It works best as a starting point — the moment you begin checking whether the trend may have changed.
Use a cross as a "cross appears, so buy / cross appears, so sell" signal and you get whipsawed by both the lag and the false signals. Treat it instead as "the cross appeared, so this is where I start confirming," and you leave room to add your own conditions (below) and filter out the false signals. Read the rest of this article with that distinction in mind.
What golden and death crosses are
First, a quick refresher on the terms.
A golden cross is when a shorter-term moving average crosses above a longer-term moving average from below. It's usually discussed with pairs like "short = 25-day, long = 75-day" or "short = 50-day, long = 200-day." It's often introduced as a sign that upward momentum is building.
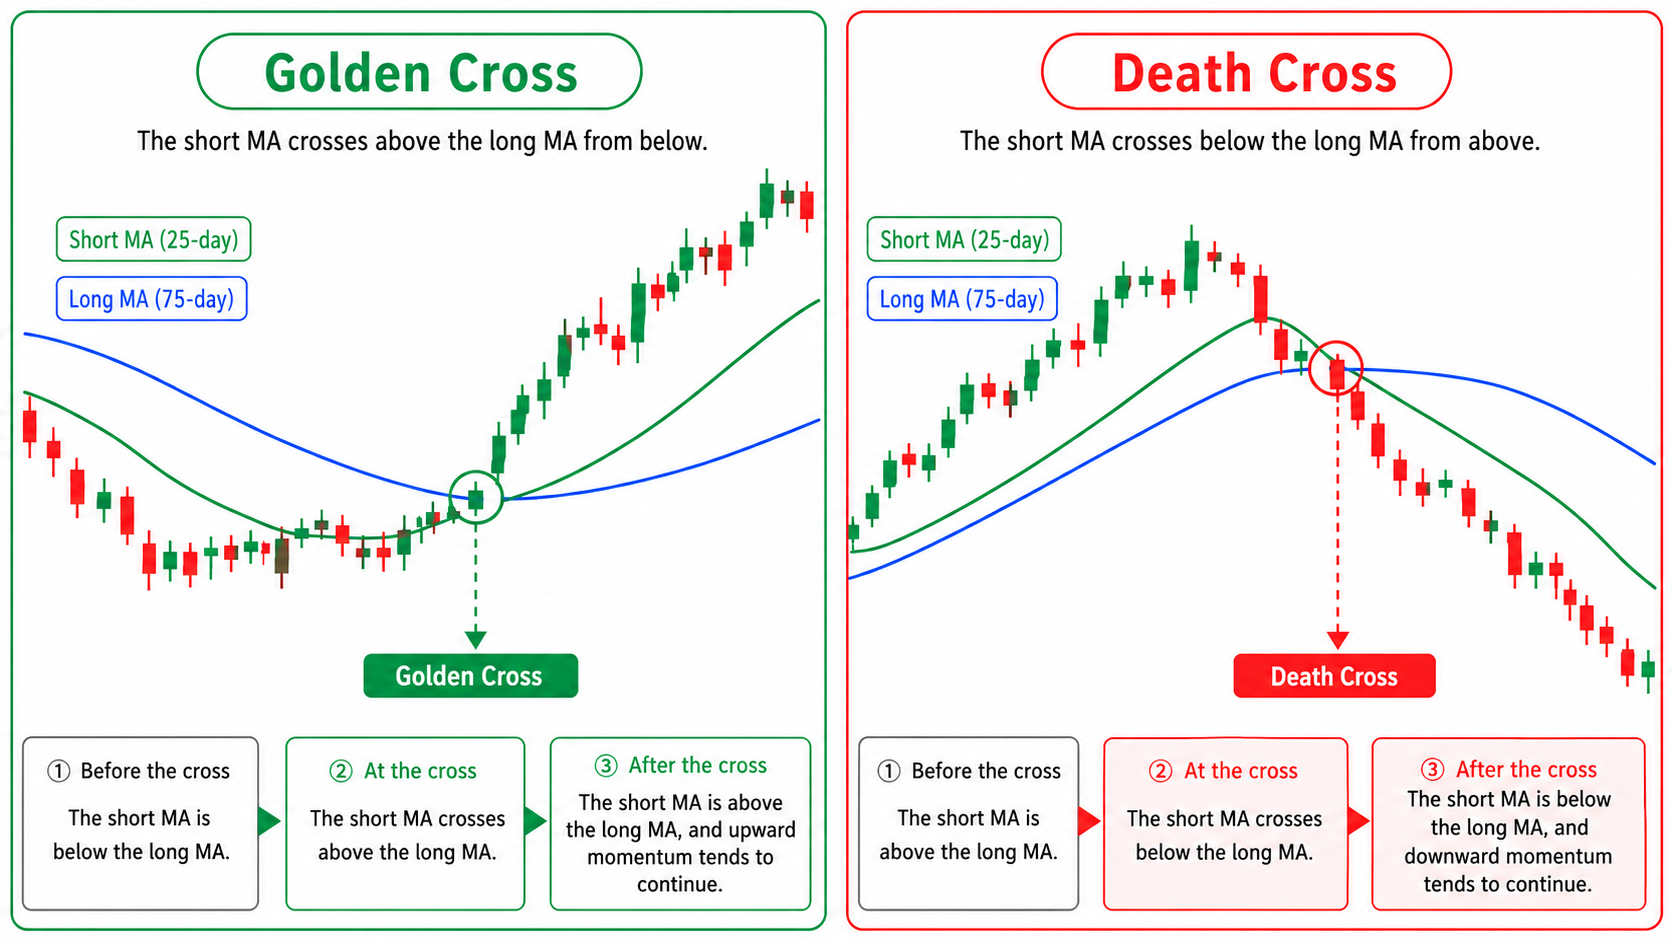
A death cross is the reverse: the short MA crosses below the long MA from above. It's described as a sign that downward momentum is building.
A moving average connects the average of closing prices over a set period, so it's smoother and slower than price itself. A cross is the intersection of two of those averages, so the lag stacks on top of the lag. That is the root of the "lag" and the "false signals" we'll come back to.
Five lenses for reading a cross
To turn a cross from a "signal" into a "starting point for confirmation," it helps to separate out a few lenses. The following are neutral guidelines, not a single right answer.
| Lens | How to think about it | Watch out for |
|---|---|---|
| Period settings (short/long) | Shorter pairs react faster but produce more false signals; longer pairs are slower but produce fewer | "Faster" isn't "better." Choose based on fit with your own time frame |
| Slope of the MAs | Are both lines clearly sloping the same way when the cross fires (not flat)? | A cross while both lines stay flat has weak direction and tends to be a false signal |
| Price position at the cross | Where is price when the cross fires (above or below the lines, far or near)? | If price is stretched far away right after the cross, a pullback can catch you |
| Market state (trend/range) | Crosses work more often in a trending market; false signals spike in a range | Judge the range first. Using crosses in a range leads to back-and-forth stop-outs |
| Higher time frame direction | Is the cross in the same direction as the higher time frame (weekly/monthly) trend? | Many traders see crosses against the higher time frame as less likely to follow through |
Period settings: the trade-off between speed and false signals
A short pairing like 5-day / 20-day reacts quickly to price. Because the cross fires early, it's easier to catch the start of a trend — but it also crosses on every little wobble, so false signals come in bulk.
A long pairing like 50-day / 200-day rarely crosses at all. You get fewer false signals, but by the time the cross fires the trend is often well underway, and it feels "too late" more often.
Neither is superior; the fit simply changes with the time frame you watch and how long you hold. If you mostly watch shorter time frames, a shorter pairing; if you hold for several weeks to months, a longer pairing — working backward from your own style is the more practical way to decide.
Slope of the MAs: a cross while the lines are flat is weak
Even when a cross fires, if both moving averages stay close to flat, the intersection is often a directionless tangle. When the two lines cross while sloping together (up or down), more traders read it as having momentum behind it.
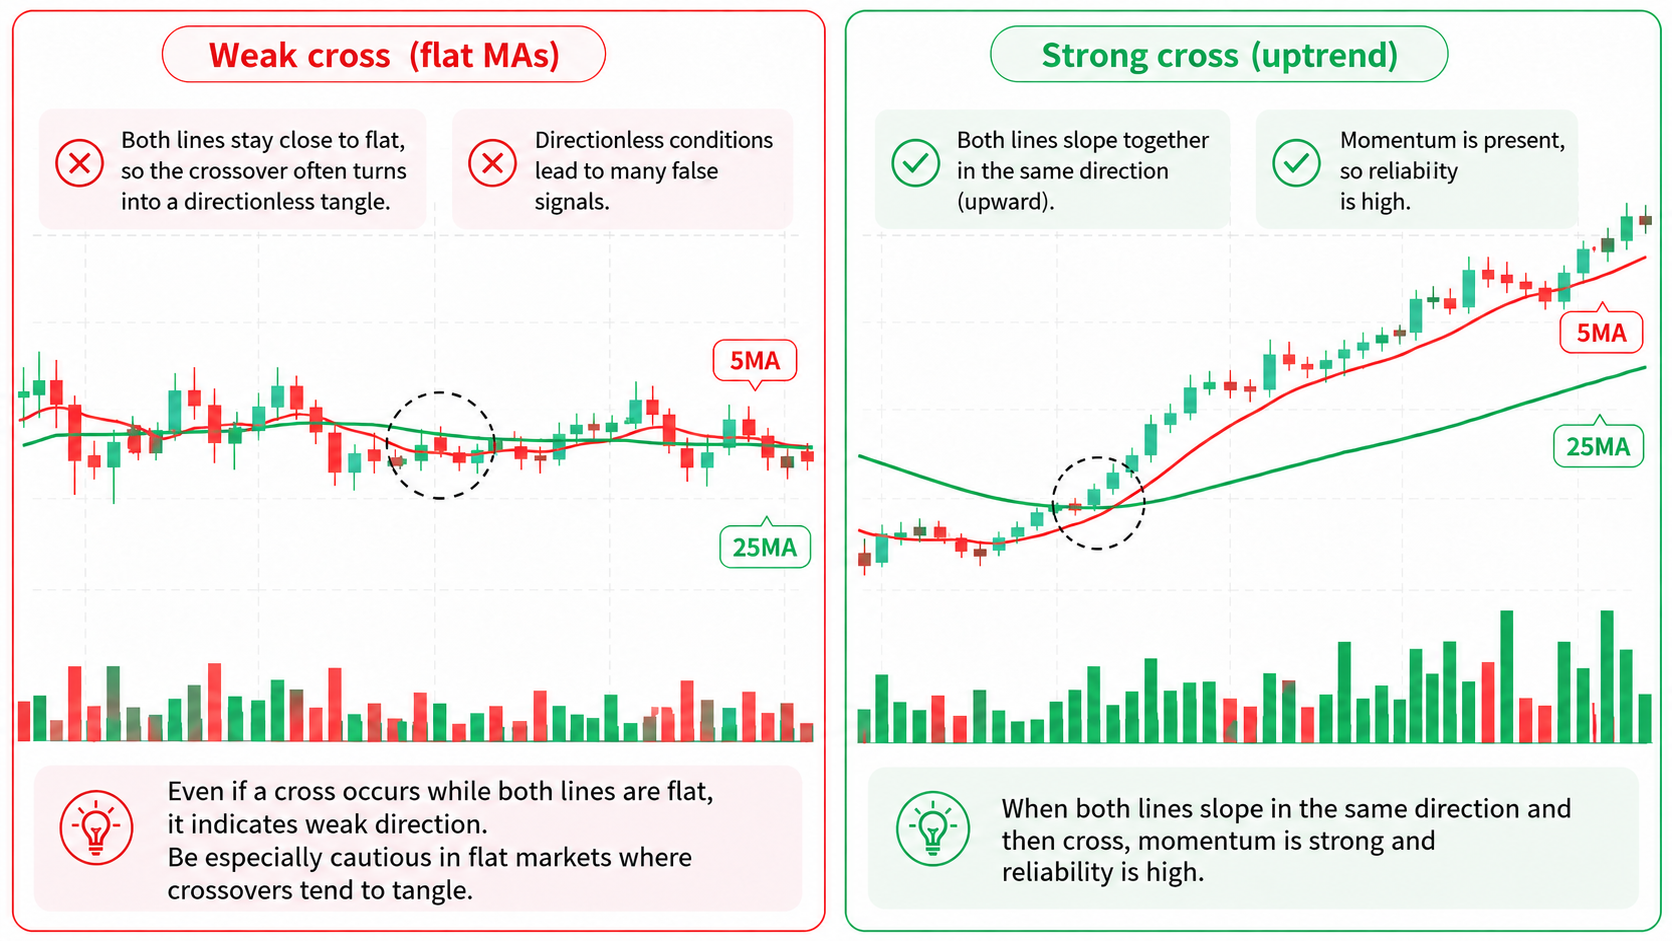
You don't need to measure the "angle" precisely. Just eyeballing whether the short and long MAs are sloping the same way already filters out a fair number of false signals in flat markets.
Price position at the cross: is price stretched too far from the line?
Be careful when a cross fires and price is already stretched far from the moving average. For example, if price is well above the short MA (the 25-day, say) when a golden cross fires, it's easy to get caught in a short-term pullback as price snaps back toward the line.
When the cross and price are still close together, it's also easier to place your exit (e.g. stop out if the line breaks), and many traders find that easier to work with. How far is "too far to take it" is another thing you can check against your own feel in a backtest.
Market state: crosses work poorly in a range
Where a cross works least is a directionless, ranging market. Every time price swings back and forth, the short and long MAs tangle, and golden and death crosses fire one after another in alternation. Trading each one turns into repeated stop-outs, like getting slapped from both sides. In a range, not just the crosses but the slope of the moving averages themselves tends to go flat — another clue that "this is a moment where crosses are hard to rely on."
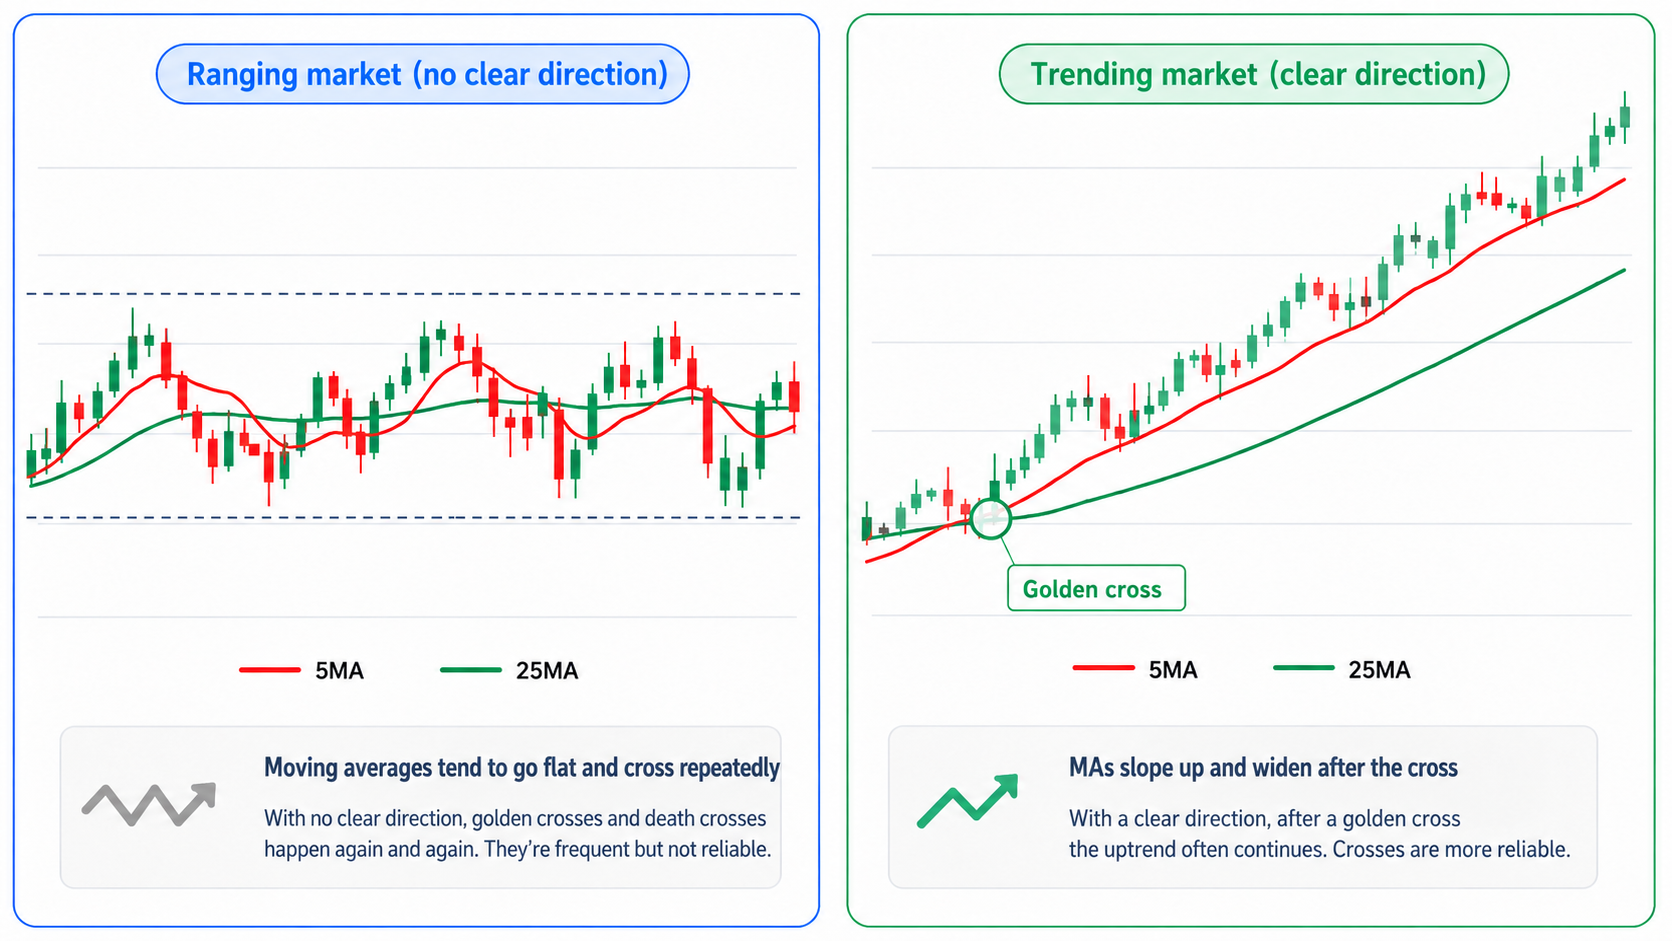
Just adding a step before you use a cross — "is this a trend or a range right now?" — avoids most of the false signals. For telling a range apart, see Range Trading Strategy: How to Trade and Backtest a Range for a detailed treatment.
Higher time frame direction: is it with the flow?
Even if a golden cross fires on the daily, if the weekly is clearly pointed down, that rally tends to be short-lived — a view many traders share. Just checking whether a cross is in line with the larger higher-time-frame flow cuts down on forced counter-trend crosses.
How to check higher time frames at the same time is covered in Multi-Timeframe Replay: See Daily, Weekly, Monthly at Once.
The trade-off: take the speed, or take the certainty?
Most of the difficulty in reading a cross comes down to a single trade-off: move early and false signals increase; wait for certainty and you lag.
- Act the instant the cross fires → you can catch the start of a trend, but you also pick up plenty of false signals
- Wait for price confirmation after the cross (a close holding, a retest, etc.) → fewer false signals, but you're late to the move
In practice, many traders don't judge on the cross alone; they also factor in the price action around it and the market environment. The point isn't "the cross is slow, so it's useless" — it's to use it together with conditions that make up for the lag.
There's no absolute right answer between the two. That's exactly why it matters to decide in advance which side you lean toward — and what backs that decision is backtesting.
Separating false signals: the thinking that ties straight to your stop
A "false signal" is when price moves the opposite way right after the cross fires: it drops just after you buy the golden cross, or bounces just after you sell the death cross. For instance, when price falls back below the long MA a few bars after you bought a golden cross, that's a classic false signal.
You can't get false signals to zero. What matters is having a rule that lets you exit quickly once you know it was a false signal — for example, "I entered on a golden cross, but if price closes clearly back below the long MA, I'm out." You decide the point where the premise of the cross has broken, ahead of time.
What to avoid here is holding a losing position, hoping it "comes back eventually." If the premise of the cross (the short above the long) has broken, then the scenario you assumed simply didn't play out. Executing an active, rules-based exit rather than enduring a drawdown is what keeps your discipline intact.
Why check it with backtesting
By now you've probably felt that "which period settings suit me" and "how long I should wait to confirm" differ from person to person and from market to market. Those can't be settled by the general advice in a book or online. Only by testing it yourself, over and over on past charts, does the form that fits you start to appear.
If you tried to test crosses in live trading, a golden cross might only appear once every few months, and it could take years to get enough repetitions. With backtesting, you can rewind past charts and reproduce the same situations as many times as you like — and because it's virtual capital, there's no real loss risk.
ENTRIQ's chart replay rewinds a past chart and advances the candles one at a time, so you can reproduce a crossover decision "from a state where you can't see what happens next." Repeating "do I trust this cross here, or stand aside?" with the future hidden is practice that's close to the real thing. For the basics, see What Is Chart Replay|Practice Trading on Past Charts.
Rule-ify entry and exit as a set
When you use a cross, if you only decide "where to get in" and not "where to get out," the test doesn't hold together. Put entry and exit into words as a set.
- Entry: the instant the cross fires / after a close holds following the cross / after waiting for a pullback (a test of the line)
- Exit (stop out): the point where the cross premise breaks (e.g. a close below the long MA) / a fixed adverse move / when the opposite cross fires
- Stand-aside conditions: when you judge it a range / when the cross is against the higher time frame
Once these three are in words, you can look back afterward at "did I act according to the rule" when you review.
Sample entries for the strategy-rules field (two patterns)
ENTRIQ has a "strategy rules" field where you record your own method in words. Here are two templates for how to write up a cross-based method. The numbers below are only examples of how to write it, and do not guarantee effectiveness or profit.
Pattern 1: Discretionary (define the situation in words)
Context read: Confirm the daily is in an uptrend with higher highs and higher lows, and the weekly is also pointing up. If I judge it a clear range, stand aside. Entry: Enter only after the short MA crosses above the long MA (golden cross) and a subsequent close holds above the short MA. Don't enter mechanically on the day the cross fires. Stop: Exit at the point the entry rationale breaks — the recent swing low, or when price closes clearly below the long MA (the candle body closes below the line, not just a wick). Exit: When upward momentum fades and the short MA turns flat to down, lean toward taking profit. Stand aside: In a range, or when the weekly is clearly pointing down.
Pattern 2: Rules-based (spell out conditions with indicators and numbers)
Entry condition: The 25-day MA crosses above the 75-day MA (golden cross), and the close confirms above the 25-day MA. Filter: At entry, the weekly 25-week MA is sloping up. Stop: −3% from the entry price, or a close below the 75-day MA — whichever comes first. Take profit: Take half the position at +9%; hold the rest until a close below the 25-day MA. Invalidation (stand aside): If the range of the last 20 bars' highs and lows is below a set width — i.e. judged a range — don't enter even if a cross fires.
The discretionary pattern is the "define the situation in words" type; the rules-based pattern is the "spell out conditions in numbers" type. Neither is superior — pick whichever you can reproduce more consistently and review more easily. Starting with the discretionary type in words and numbering parts of it as you get used to it is also an easy way to progress.
Test it and record it
Once your rule is set, run past crossover situations many times in ENTRIQ's chart replay and record the results. Tagging each trade with a strategy tag (e.g. "golden cross — wait for a confirmed close") lets you aggregate win rate, average risk-reward, P/L and more across only the trades of that same method, automatically. How to keep records is covered in detail in How to Keep a Trading Journal with Strategy Tags.
One caution here. While your sample size is small, don't take the aggregated numbers at face value. A win rate from 5 or 10 tests is likely just chance, and isn't enough to say whether a method is good or bad. That's exactly why it's worth stacking repetitions with zero-risk backtesting.
{ "type": "bar", "title": "Sample backtest results by how long you wait to confirm the cross (illustrative data)", "subtitle": "Average risk-reward in sample backtests (x)", "data": [ { "label": "Enter on the cross day", "value": 0.8, "color": "#0D9488" }, { "label": "Wait for a confirmed close", "value": 1.3, "color": "#0D9488" }, { "label": "Wait for a retest", "value": 1.6, "color": "#0D9488" } ], "valueSuffix": "x", "valueFractionDigits": 1 }
The chart above contains illustrative, hypothetical data meant to show that "the tendency of results can shift depending on how long you wait to confirm." It does not represent actual performance or effectiveness. Gather your own numbers from your own testing.
Once you've built up test data, you can also organize the tendencies with ENTRIQ's AI Analysis. AI Analysis isn't a trading signal or a prediction; it's a feature that puts "observed tendencies" into words from your past trade data and notes. For example, it can surface a pattern that's hard to notice yourself, like "trades entered on the cross day ended in a stop-out more often than trades that waited for a confirmed close." For more, see Review Your Trades with AI Analysis: Find Your Tendencies.
Four common mistakes
Four points where people trip up when testing crosses.
1. Using crosses in a range The most common mistake. Using a cross as a buy/sell signal in a directionless market means repeated stop-outs from the back-and-forth. Just adding the "trend or range" judgment first improves this a lot.
2. Entering mechanically on the day the cross fires Enter every time the instant the cross fires and you pick up every false signal. The point of testing is to try conditions like waiting for a confirmed close or a retest, and find the way of waiting that fits you.
3. Entering without deciding an exit Enter thinking "it's a golden cross, so it should go up," with no exit rule, and if it drops your loss balloons when it turns out to be a false signal. Put "what would make me admit I'm wrong" into words before you enter.
4. Remembering only the crosses that worked The golden crosses that worked stay in memory; the ones that were false signals get forgotten. That leaves a biased impression that "crosses work well." Only by keeping records and reviewing all of them — false signals included — does the real tendency come into view.
Frequently asked questions (FAQ)
Q. Should I just buy when a golden cross appears? A. Using a cross on its own as a "cross appears, so buy" signal tends to get you whipsawed by the lag and false signals. This article treats a cross as "a starting point where you begin confirming that the trend may have changed," and adds conditions like the market state, the higher time frame direction, and how long to wait to confirm. Which conditions fit you is something you verify with backtesting.
Q. What days should I set for short and long? A. There's no "correct" setting. Shorter pairs react faster and produce more false signals; longer pairs are slower but produce fewer — that's the trade-off. Match it to your own time frame and holding period, and comparing several settings through backtesting is the practical way to go.
Q. Which moving-average combinations are commonly used for golden and death crosses? A. There's no fixed right answer, but on the daily, "short 25-day / long 75-day" is common, and for reading a larger wave, "short 50-day / long 200-day" is often cited. Shorter pairs react faster with more false signals; longer pairs react more slowly with fewer. Which suits your time frame is best confirmed by comparing several settings in a backtest.
Q. Why are crosses called "slow"? A. A moving average is the average of closing prices over a set period, so it's smoother and slower than price itself. A cross is the intersection of two of those averages, so the lag stacks further. If you want speed, a shorter setting; if you want certainty, a longer setting — the key is to use it understanding that trade-off.
Q. Is a death cross a signal to go short? A. Just like the golden cross, a death cross is better treated as a starting point for confirmation than as a standalone signal, so you're less likely to get whipsawed. Apply the same "market state," "higher time frame direction," and "exit rule" covered in this article, and verify your own judgment with backtesting. Note that this article does not recommend trading; it covers how to practice the decision.
Q. Is there a way to eliminate crossover false signals completely? A. There's no way to get false signals to zero. What matters is deciding, ahead of time, a rule that lets you exit quickly once you know it's a false signal (such as the point where the cross premise breaks). Recording them — false signals included — and checking "how well my rule separates out the false signals" through backtesting is the realistic way to deal with it.
Q. Some people enter before a golden cross forms. Is that wrong? A. It's not wrong. But that's using the cross as a predictive input rather than a confirming one. Entering before the cross forms lets you move earlier, but you're entering while the cross hasn't yet completed — the premise isn't confirmed — so you also pick up more situations you should have stood aside on. This article presents treating the moment after a cross actually fires as the starting point for confirmation, but which fits you is something to verify with backtesting.
Summary
As a standalone signal for deciding trades, golden and death crosses carry too much lag and too many false signals to be easy to work with. But reframe them as "a starting point where you begin confirming that the trend may have changed," and add conditions like the market state, the higher time frame direction, and how long to wait to confirm, and you can grow them into a rule of your own.
Whether that rule fits you can't be settled by general advice in a book or online. Test it many times on past charts, record all of it — false signals included — and review it. Only through that repetition does the form that fits you appear.
If you'd like to organize the other ways to use moving averages (slope and reactions) as well, head back to the overview article, Moving Average Strategy: Slope, Crossovers, and Backtesting.
ENTRIQ is a stock practice and backtesting tool for individual traders that integrates chart replay, trade journaling, and AI Analysis. It was built for the workflow of repeating crossover decisions in backtesting rather than in live trading, and working them into a rule of your own. If you value repeatable practice volume over a longer feature list, start with the 14-day free trial.
Disclaimer: This article is for informational purposes only and is not investment advice. It does not guarantee the effectiveness or profitability of any specific method or indicator, nor does it promise future results. All figures and charts in this article are illustrative, hypothetical samples. All investment decisions are made at your own responsibility. ENTRIQ is not an investment advisory business.
Reproduce this validation yourself
With ENTRIQ's chart replay, you can trade through past charts using the same rules.
Start 14-day free trialValidate your method on past charts
The same validation in this article can be reproduced with your own method. On past charts, do the classics really work?
- ✓ Replay past charts
- ✓ AI feedback on your trades
- ✓ Validate methods with statistics