TradingView Bar Replay|5 Limits for Serious Backtesting
Five situations where TradingView's Bar Replay falls short once you backtest seriously — deep history, the forming bar, multi-symbol sync — and how to solve each.
Backtesting price action with bar replay is one of the most effective ways to sharpen your trading. Plenty of traders rely on TradingView's Bar Replay to step through historical price bar by bar and rehearse their entry decisions.
TradingView's Bar Replay is a genuinely good tool. But once you start putting in serious repetitions, you start running into moments where you wish it did just a little more. This article breaks down five situations where TradingView's Bar Replay tends to fall short — based on TradingView's own published pricing and feature specs — and how to work around each one.
To be clear, this isn't a hit piece on TradingView. It's the go-to platform for monitoring, charting, and sharing ideas, and for most serious traders the realistic answer is running it alongside a dedicated backtesting tool — a "two-app setup" rather than choosing one over the other.
(For the basics of how chart replay works and how to get started, see our separate article, "What Is Chart Replay|Practice Trading on Past Charts." This article picks up where that one leaves off, moving on to what happens when you start backtesting in earnest.)
What is Bar Replay?
Bar Replay rewinds a chart to an earlier point and lets you advance the candles one at a time (or play them back continuously), so you can experience past price action with the right-hand side hidden — exactly like live trading. Because you're judging the market without knowing what comes next, you can rehearse entries, stops, and exits over and over without knowing the outcome in advance.
Backtesting is the trading equivalent of taking practice swings. Before you put real money on the line, you repeat the same decision hundreds or thousands of times to build up speed and consistency in how you react to chart patterns. The quality and volume of that repetition is what really matters in a backtesting tool.
Situation 1: Going deep into the past on intraday timeframes requires a higher-tier plan
First, an important clarification: Bar Replay itself is available on every plan, including the free Basic tier. Bar Replay is not a paid-only feature.
Where the tiers differ is the depth of historical data you can replay. Based on TradingView's official support pages, the depth you can reach varies by plan and timeframe:
- Daily and higher timeframes: full chart history on every plan.
- Minute (intraday) data: lower tiers reach back less far. Essential, for example, covers around six months of one-minute data, double that on the two-minute, and longer still on the three-minute — the depth grows with the timeframe.
- Premium and the higher (professional) tiers: TradingView states these can replay all the time-based data in its storage. For any interval, you can go back as far as the symbol's data exists.
- Second-based and tick: second-based data has a common cutoff based on how far back it's stored, and tick-level replay is limited to a recent window on the top tier.
If you want to replay second-based or finer timeframes deep into the past, the Premium tier or above is effectively the benchmark. The depth of history available varies by symbol and timeframe, so confirm the current terms on the official page.
In short, wanting to replay one-minute charts from years back, or to rehearse on finer timeframes, tends to push you toward a higher-tier plan. The shorter the timeframe you want to backtest on, the more the higher-tier cost tends to stack up, which hits intraday and scalp-style traders hardest.
Note: TradingView's plans are the free Basic tier plus the paid Essential, Plus, Premium, and Ultimate tiers (as of 2026). Prices change with revisions and sales, and the annual-billing discount differs by tier. Always confirm current figures and terms on TradingView's official page.
Situation 2: The forming higher-timeframe candle is hard to reproduce in backtesting
This is a backtesting-accuracy problem that anyone practicing multi-timeframe analysis runs into.
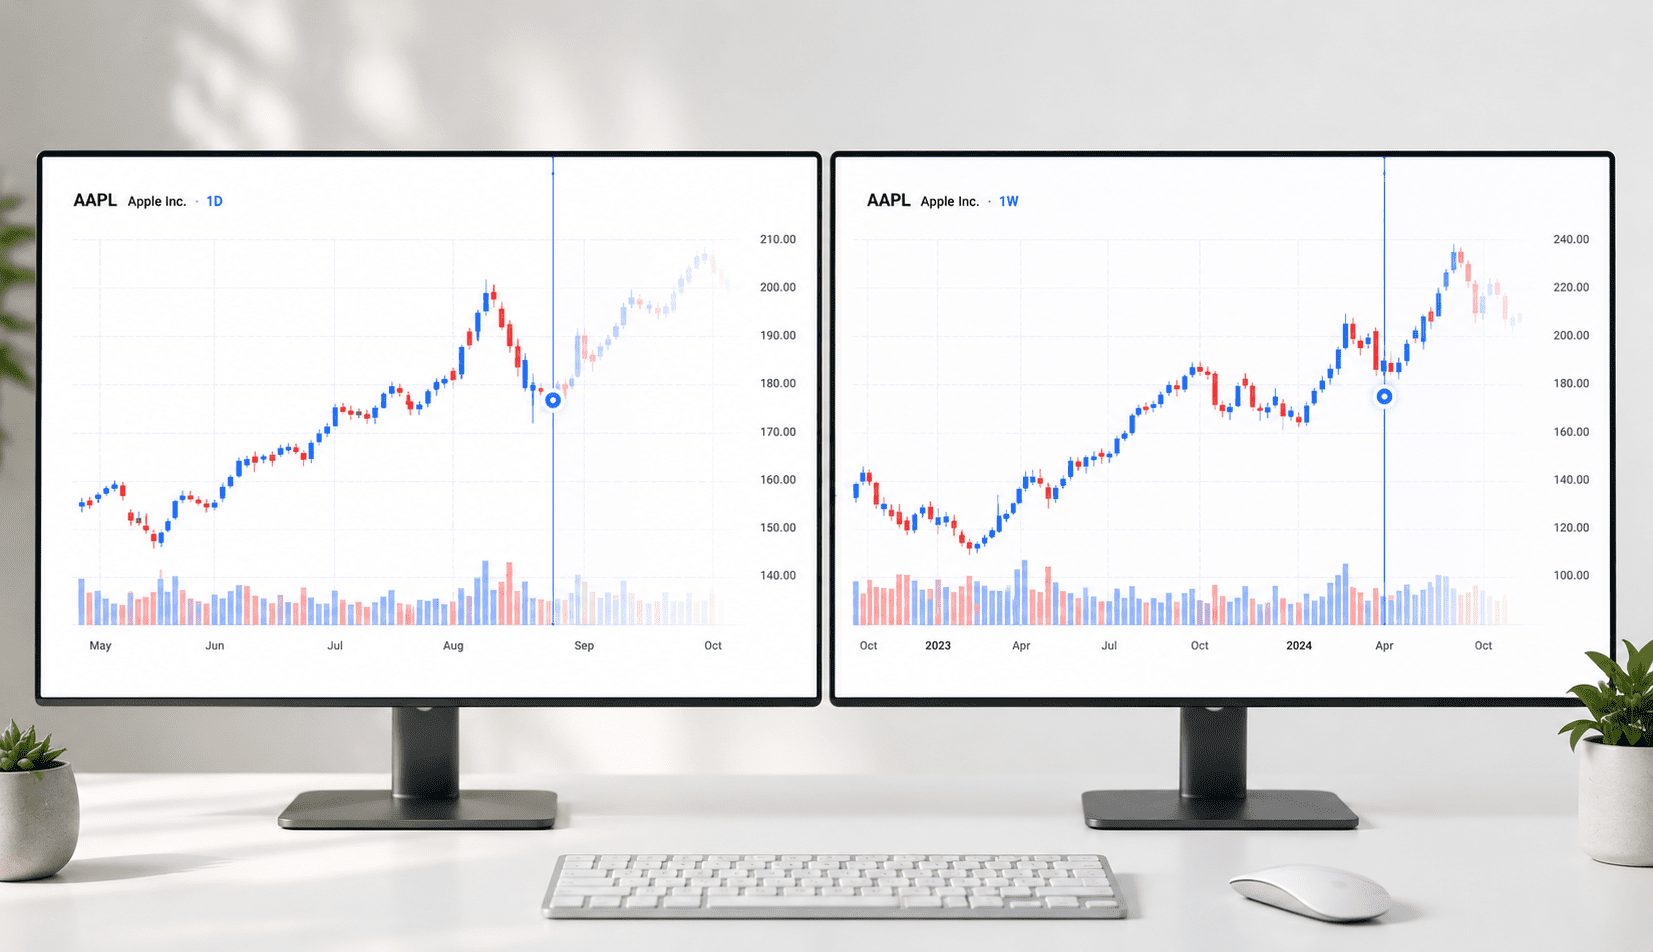
In chart replay, the key to realistic practice is judging not just by the completed candles but by the latest one currently forming — the forming candle. But that forming candle becomes hard to reproduce the moment you span multiple timeframes.
In live markets, your weekly candle is the one currently forming — it stretches and shrinks throughout the week as price moves. Mid-week, you're reading whether the weekly is printing a long upper wick and stalling, or pushing its body higher with conviction, and you make decisions off that.
But when you advance a lower timeframe (daily) bar by bar in replay, the higher timeframe (weekly, monthly) often only renders the completed candle once that week or month closes. The screen you're studying in replay no longer matches the screen you watch in real time. That gap is one reason traders feel "I nailed it in backtesting, but I can't make the same call live."
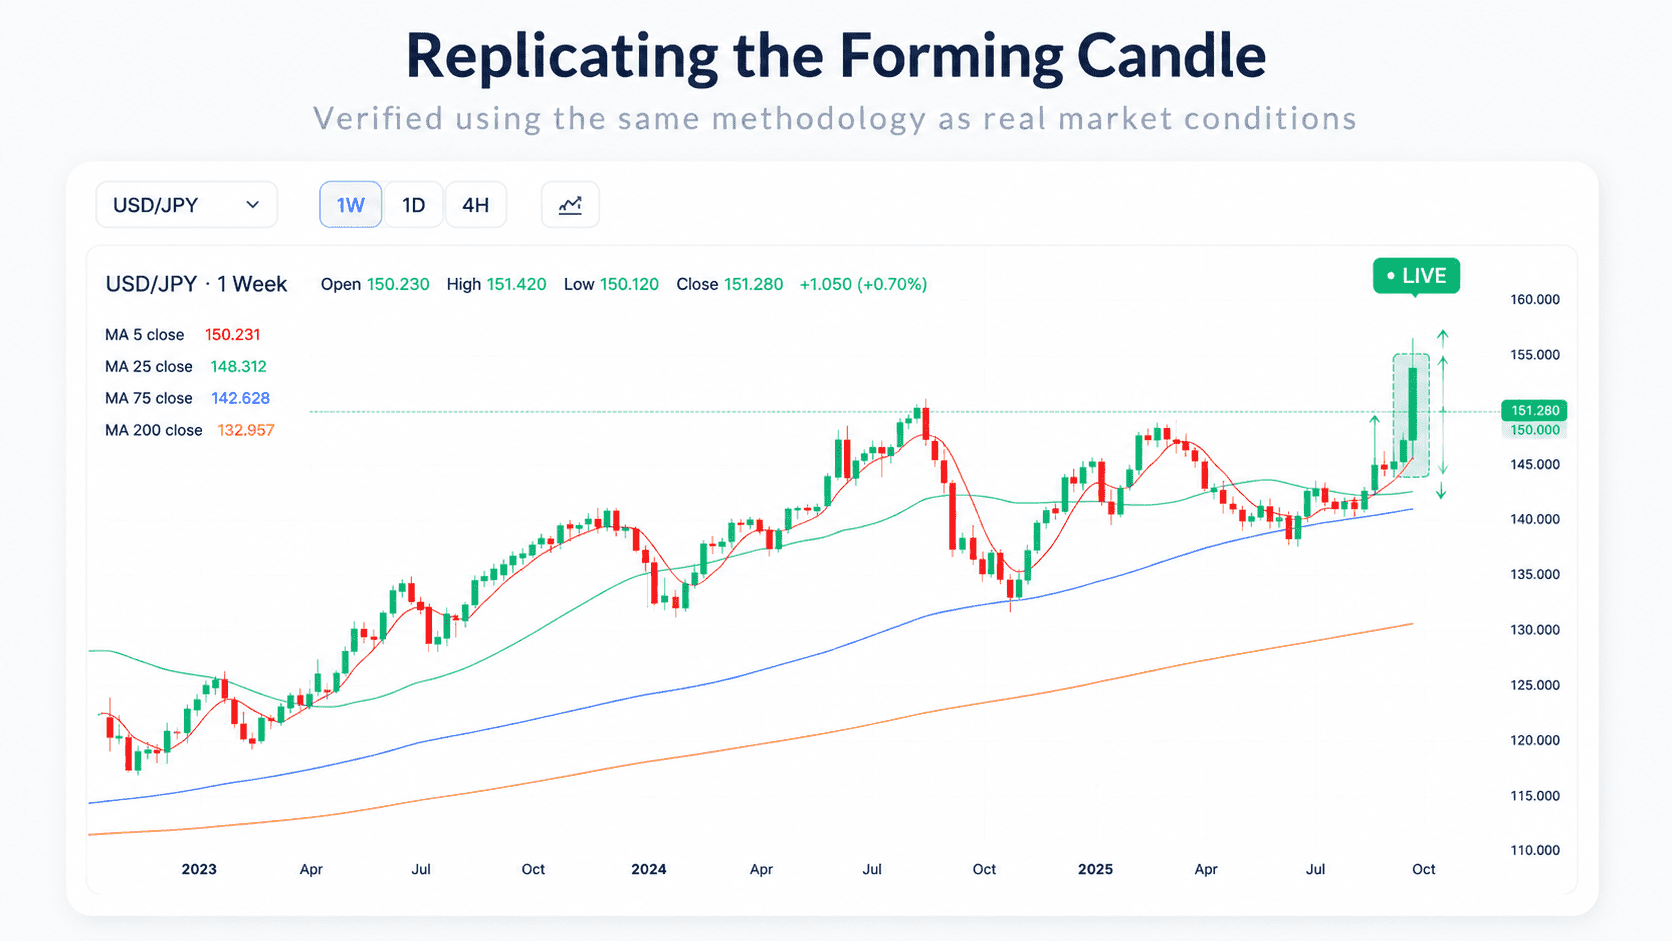
Some traders who lean on multi-timeframe analysis find this point — the higher timeframe only ever moving as a completed candle — a real sticking point. In live trading you read the weekly's mid-week progress and decide off it, but in backtesting you can't reproduce that. To close that gap, ENTRIQ builds in the forming bar method (a confirmed candle plus the in-progress candle). Every time you advance a lower-timeframe bar, the higher timeframe updates as a forming candle in real time, bringing the replay screen much closer to how the market actually looks live.
(TradingView does offer features like Bar Magnifier that assist with how replay renders, so this can be eased depending on the setup. The point here is that in a standard replay workflow, the higher-timeframe formation is hard to reproduce.)
Situation 3: Hard to view multiple symbols side by side with synchronized time
As your backtesting matures, you'll want to view a single market moment across multiple symbols at once — comparing lead/lag within a sector, or checking how an index and an individual name move on the same timeframe.
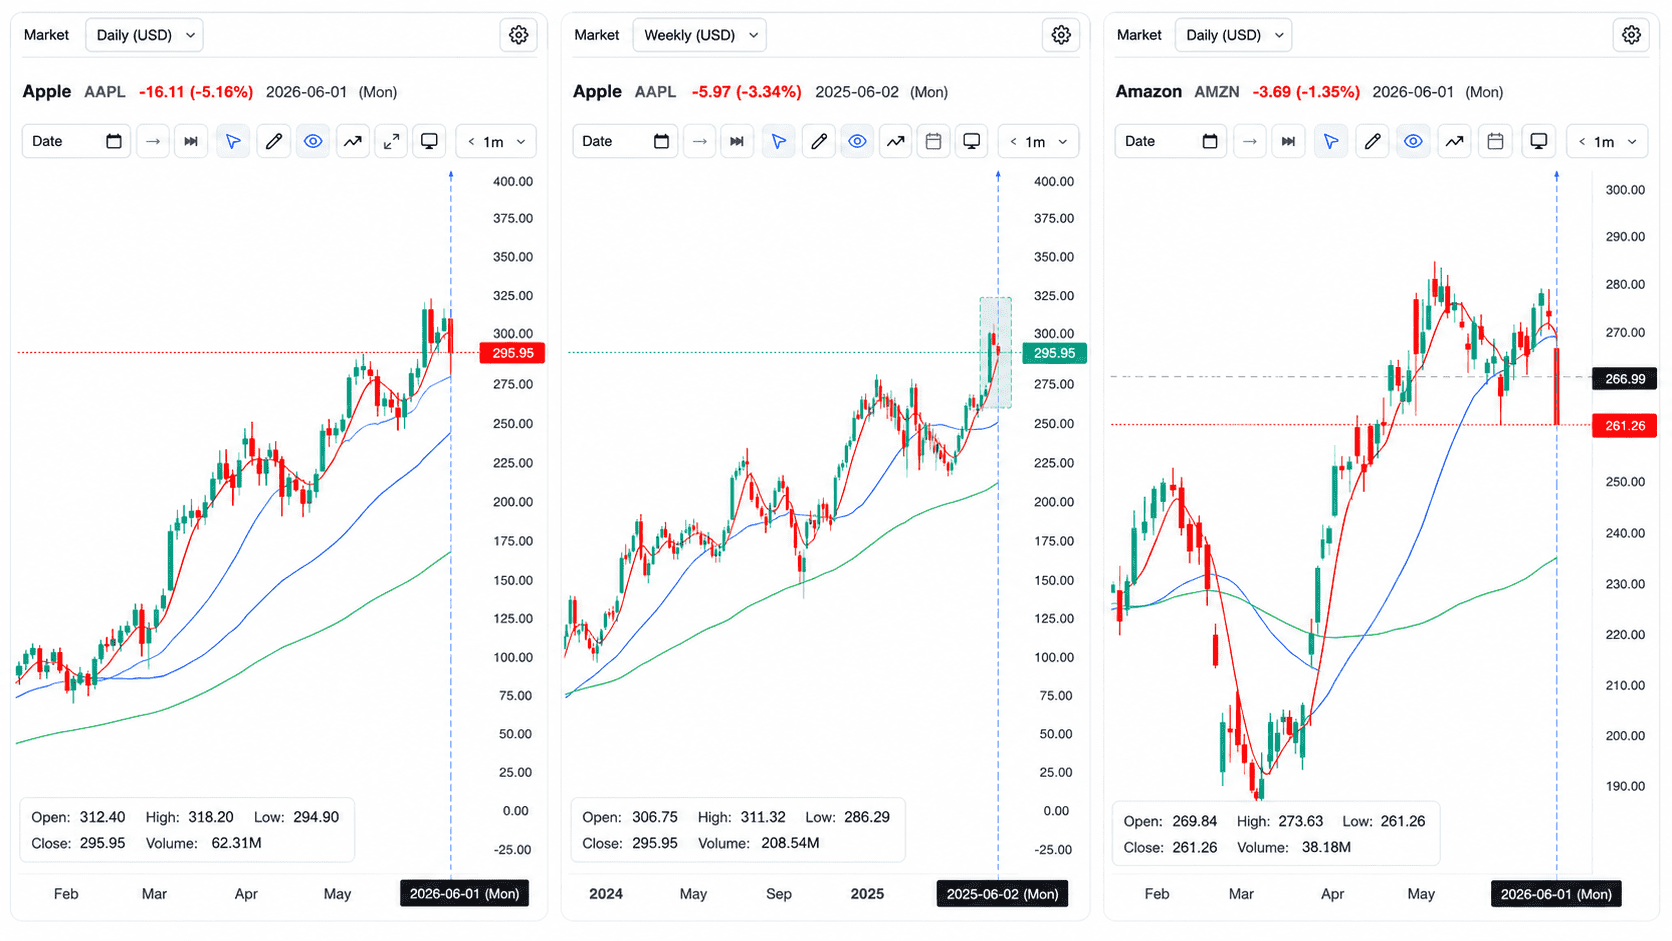
TradingView caps how many charts you can place side by side per plan, with higher tiers allowing more charts in one layout. Replay also has an "All charts" mode that advances multiple charts together, synchronizing them in time across the layout. Still, keeping multiple charts replaying with fully synchronized time — and matching forming bars — takes some extra setup in a standard workflow.
ENTRIQ lets you arrange multiple displays and switch symbols on the sub-displays to backtest several symbols at once. Each sub-window picks its own symbol independently, while the timeframe follows the main window and the replay progress (including the forming bar) stays synchronized in real time. The design principle is simple: the main window owns the time axis, and the sub-windows ride on top of it, swapping only the symbol.
This lets you observe the same market moment across several symbols in parallel and compare how each one reacts — at the same time.
Situation 4: Hard to rack up sheer practice volume through repetition
The value of backtesting shows up, above all, in the number of repetitions. You see the same pattern hundreds of times until your reaction becomes second nature. How easily a tool lets you repeat is a huge part of its usability.
What pays off especially is drilling one specific past period over and over. Replaying the 2008 crash twenty times, the 2020 COVID crash and its rebound thirty times, or focusing only on drops of 40% or more — deliberately repeating the same kind of market sharpens your reaction to that period's particular price action. The less often you encounter a situation in the wild — a crash being the prime example — the more it pays to get familiar with it through repetition before it happens for real.
General-purpose charting platforms are multi-purpose — monitoring, drawing, idea-sharing, screening — and aren't necessarily optimized for the single goal of grinding out repetitions. Quickly jumping the replay start point to a target crash period, then moving straight on to the next one over and over, is the kind of "raise your swing count" workflow that a purpose-built environment handles better.
ENTRIQ is designed around exactly this — drilling specific periods and racking up repetitions. Setting the start point, switching symbols, and repeating the loop are all arranged to keep the practice rhythm from breaking, so deliberately drilling a past crash period again and again is straightforward.
Situation 5: Weak tooling for tagging and reviewing your backtest results
Backtesting without review doesn't translate into improvement. Only by recording "which strategy, in what kind of market, and how I decided," then sorting and reviewing it afterward, does the improvement loop actually start to turn.
Bar Replay on a general-purpose platform lets you practice, but tagging results by strategy, leaving notes, and statistically reviewing your backtest history afterward — building up your testing as an asset — isn't its main purpose.
ENTRIQ is designed to combine trade history, notes, strategy tags, and AI analysis so your backtesting accumulates as stored data. Reviewing by strategy tag lets you see, after the fact, which approach worked in which kind of market. The AI analysis presents observation-based summaries of past price action and trades — it does not predict future prices or recommend trades.
TradingView and ENTRIQ: how the roles differ
Here are the five situations laid out as a difference in roles. It's not that one is better than the other — they're good at different things.
| Aspect | TradingView | ENTRIQ |
|---|---|---|
| Monitoring, charting, idea-sharing | Strong | Built for backtesting |
| Bar replay | Yes | Yes |
| Forming higher-timeframe bar | Hard to reproduce in a standard workflow | Supported (forming bar method) |
| Synchronized multi-symbol time | Takes extra setup in places | Supported (multi-display) |
| Test history / strategy tags | Not the main purpose | Supported |
| AI analysis | Not the main purpose | Supported |
The fix: run TradingView and a dedicated tool as a "two-app setup"
Given this table, the answer isn't to drop TradingView. It's to split the roles.
- Monitoring, charting, idea-sharing, screening: TradingView's strengths
- Deep historical replay, reproducing the forming higher-timeframe bar, synchronized multi-symbol backtesting, accumulating results: the domain of a dedicated backtesting tool
Do your day-to-day market monitoring and indicator work in TradingView, and run a dedicated tool as your "practice range" for putting in serious repetitions. This two-app setup tends to balance cost and testing quality well. Buying replay depth through a higher TradingView tier is one option, but keeping a separate, backtesting-focused environment lets you use each tool for what it does best.
Frequently asked questions (FAQ)
Q. Can I use TradingView's Bar Replay for free? Yes. Bar Replay itself works on every plan, including the free Basic tier. However, advanced use — replaying deep history on intraday timeframes, or trading inside replay — is unlocked on higher tiers, or the reachable depth widens with them.
Q. Which TradingView plan do I need for serious backtesting? If you want to replay deep history on minute timeframes, the Premium tier or above is the practical benchmark. TradingView states that Premium and the higher (professional) tiers can replay all the time-based data in its storage. The depth available varies by symbol and timeframe, and pricing changes with revisions and sales, so confirm current pricing and terms on TradingView's official page.
Q. Can I use ENTRIQ and TradingView together? Yes. They serve different roles and are designed to be used together — TradingView for everyday monitoring and charting, ENTRIQ for serious repetition-based backtesting.
Q. Can I backtest multiple symbols at once? With ENTRIQ, you can arrange multiple displays, switch symbols on the sub-displays, and backtest several symbols at once with the timeframe and replay progress (including the forming bar) kept in sync.
Summary
TradingView's Bar Replay is an excellent feature, but once you're putting in serious repetitions you may run into five situations where it falls short: reaching deep history (tends to need a higher tier), reproducing the forming higher-timeframe bar, synchronized multi-symbol backtesting, ease of repetition, and accumulating your results.
None of these mean dropping TradingView — they're solved by running a dedicated backtesting tool alongside it. ENTRIQ is built precisely as that "practice range" for serious, repetition-based backtesting.
ENTRIQ is a stock practice and backtesting tool for individual traders, combining chart replay, trade journaling, and AI analysis in one place. If you're ready to make backtesting a real habit, try the 14-day free trial and see the replay depth and ease of repetition for yourself.
Note: This service is not an investment advisory business. The information provided is reference information based on historical data. All investment decisions are your own responsibility.
This article is for informational and educational purposes only. It does not recommend any specific security or trading method, nor does it guarantee future price movements or profits. All trading decisions are your own responsibility. Pricing and specs for third-party services referenced here are based on publicly available information as of June 2026; confirm the latest details on each provider's official page.
Reproduce this validation yourself
With ENTRIQ's chart replay, you can trade through past charts using the same rules.
Start 14-day free trialValidate your method on past charts
The same validation in this article can be reproduced with your own method. On past charts, do the classics really work?
- ✓ Replay past charts
- ✓ AI feedback on your trades
- ✓ Validate methods with statistics