How to Practice the 2008 and 2020 Crashes with Chart Replay
Crashes hit live markets only once every few years, but on historical charts you can replay them endlessly. Using the 2008 and 2020 crashes, here's how to practice reading a sell-off with no capital at risk—and what two very different declines teach you.
How you'll act when the market breaks down hard—this is, for many traders, the thing they most want to practice and least get to. Crashes only show up in live markets once every few years. If you wait for the next one to train your decisions, you'll rarely get enough real-world experience.
This is where backtesting becomes valuable. With historical charts, you can rewind the 2008 crash or the 2020 crash and replay the moment as many times as you want. And because it runs on virtual capital, a wrong call costs you nothing. In this article, we'll use these two historic crashes to walk through how to practice decision-making in a sell-off with ENTRIQ's chart replay.
The basics of backtesting and chart replay themselves are covered in What Is Chart Replay? How to Practice Stock Trading on Past Charts. This article is the applied next step: how to practice the hardest situation of all.
Why a Crash Is Exactly What You Need to Practice
A normal market and a crashing market behave so differently they're almost two separate things. The range of price moves swells to several times the usual size, support levels and trendlines that normally hold get sliced through one after another. And above all, on the other side of the screen, your own emotions get violently shaken.
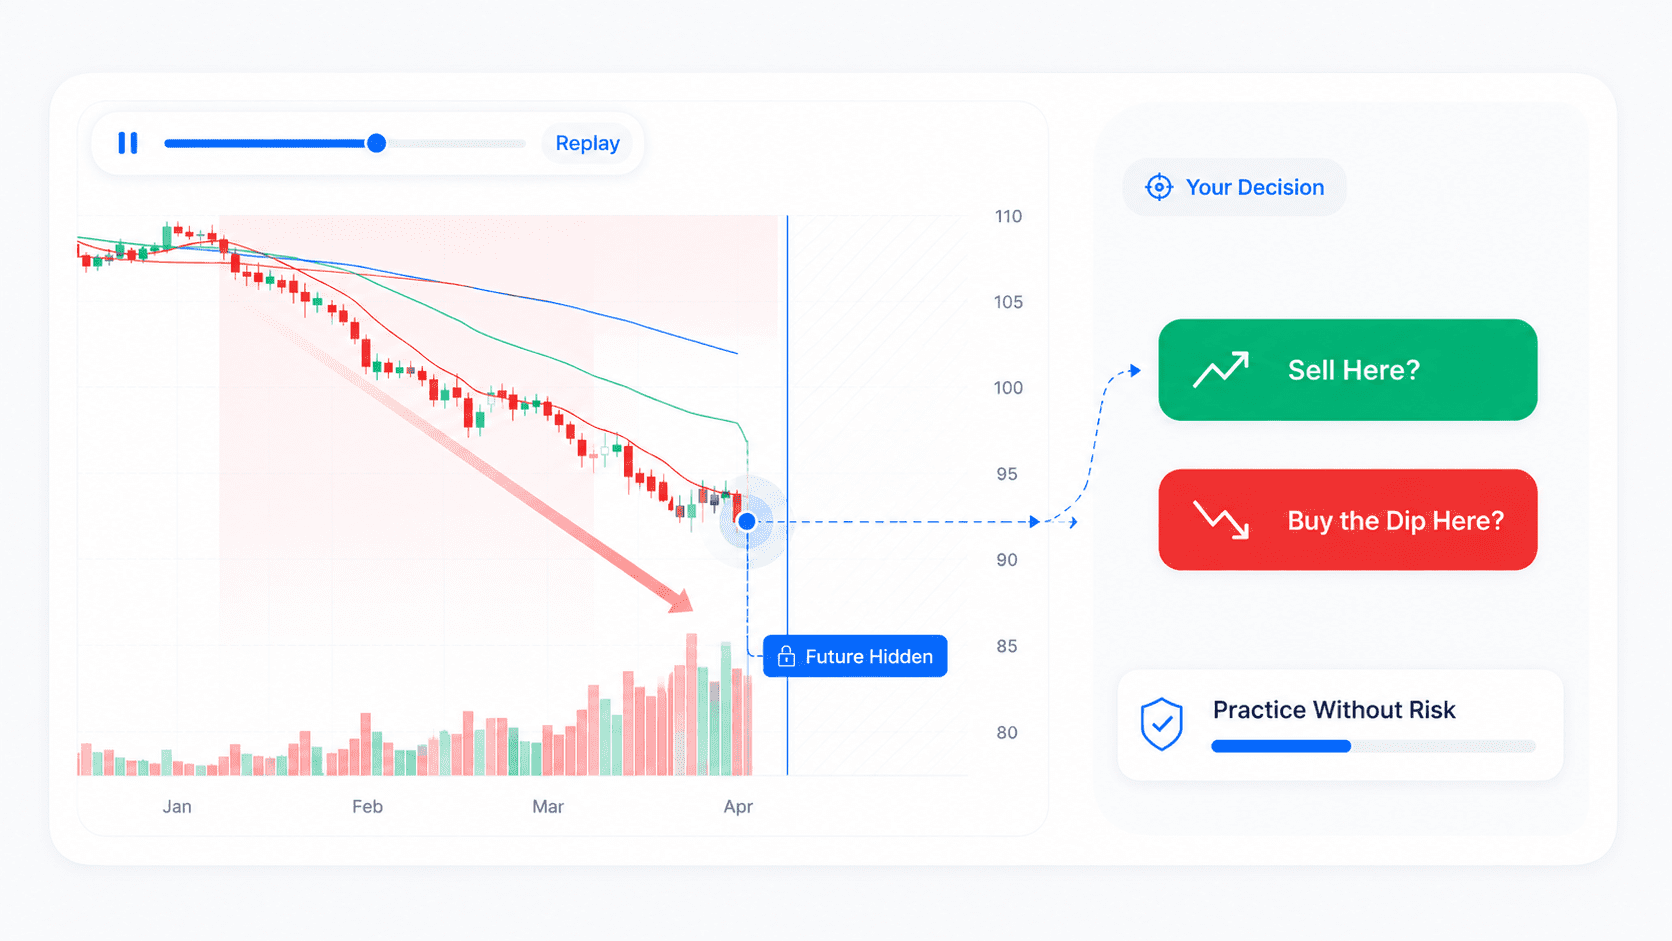
That "emotional shaking" is the real reason crashes are so hard. Panic-selling into the drop out of fear, or repeatedly trying to catch the bottom too early—these are not things you can fix by staring at calm-market charts. You need the experience of watching a screen keep dropping, with the future hidden from you.
Backtesting lets you build that experience without real losses. Rewind the crash chart, start with the future hidden, and step forward one bar at a time. Decide "do I sell here?" or "do I pick this up here?" without knowing the outcome. Repeat that enough times, and when a real crash arrives, you'll have a foundation that's harder to wash away in the heat of the moment.
Case 1: The 2008 Crash—A Slow, Grinding, Long Decline
First, the character of it. The 2008 crash wasn't a single sharp drop so much as a long, grinding decline that kept going.
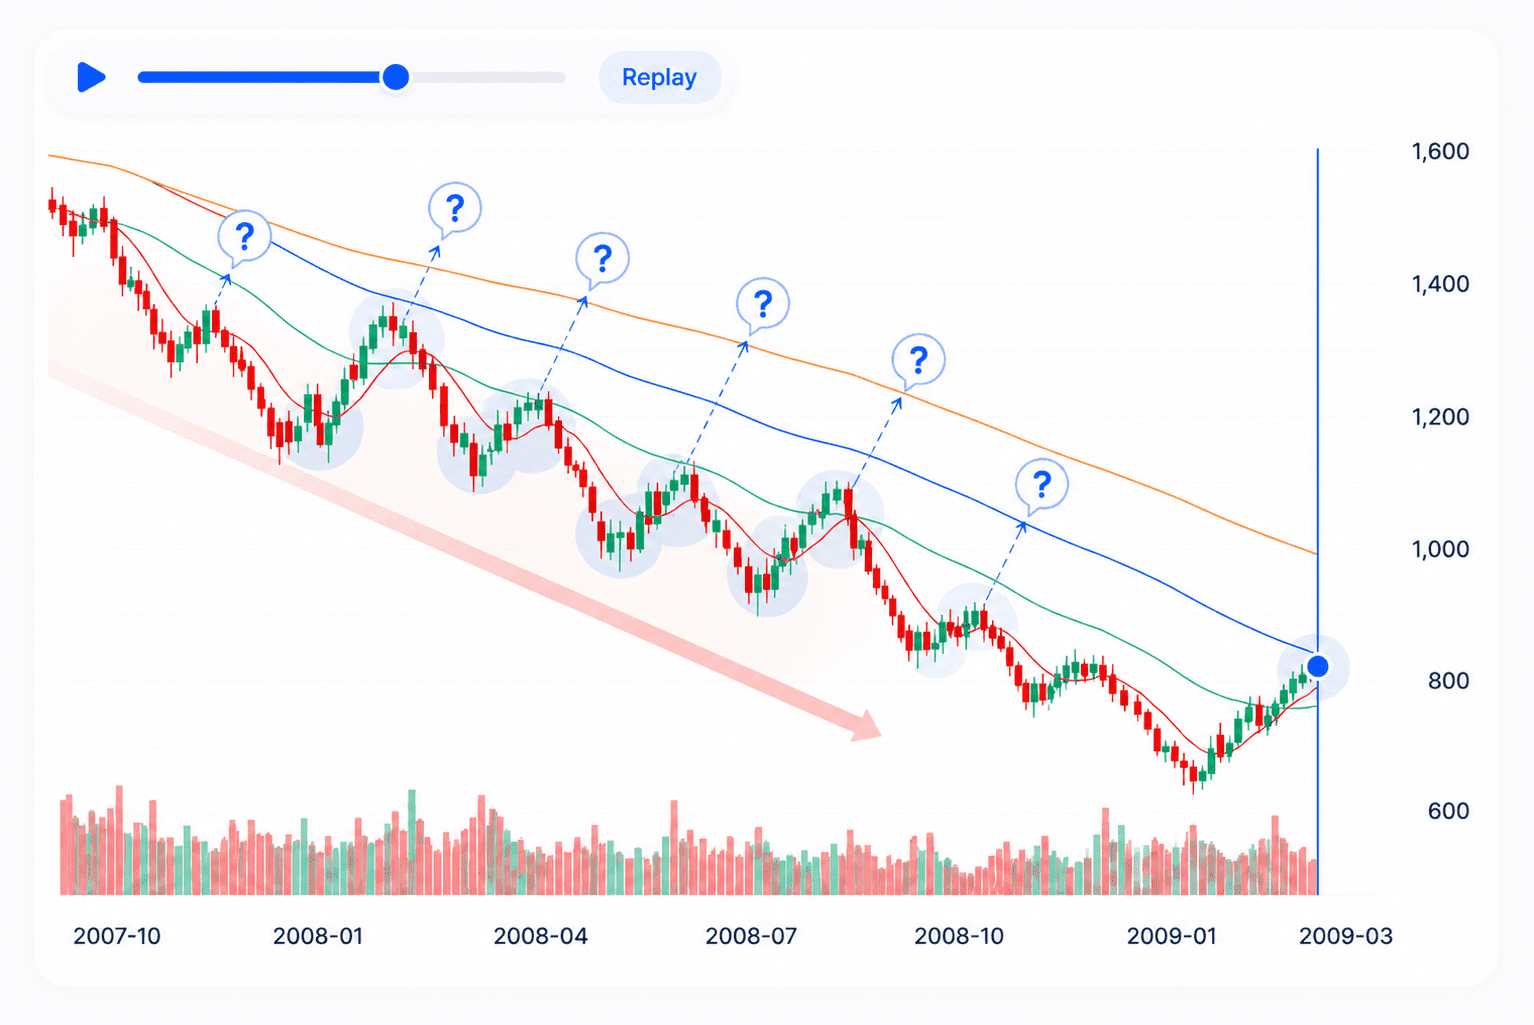
Looking at the S&P 500 as a broad-market reference, the index fell more than 50% over roughly a year and five months, from its October 2007 high to its March 2009 bottom (cited here as a reference for the overall market). Along the way it threw out rally after rally that each looked like "surely this is the bottom," only to undercut the lows again—the kind of decline that tests your patience.
What this long-form crash trains is the experience of getting chopped up buying every bounce. In a downtrend, powerful-looking rebounds appear over and over. You judge "this is the bottom," buy, then it drops again and you stop out—this is the pattern that catches most people in a prolonged decline.
In ENTRIQ, what you practice on is the individual US stocks that moved hard at the time—financial-sector names that sold off violently in 2008, for example. You rewind them in replay and check, without knowing the outcome, "how do I actually react to a bounce in the middle of a downtrend?"
In long-decline practice, what you want to watch isn't the win/loss itself but "how many times did I bottom-fish too early?" Run the replay enough and the spots where your hand tends to twitch start to reveal themselves.
Case 2: The 2020 Crash—Violent, Fast, and a Quick Recovery
The 2020 crash has the opposite character to 2008.
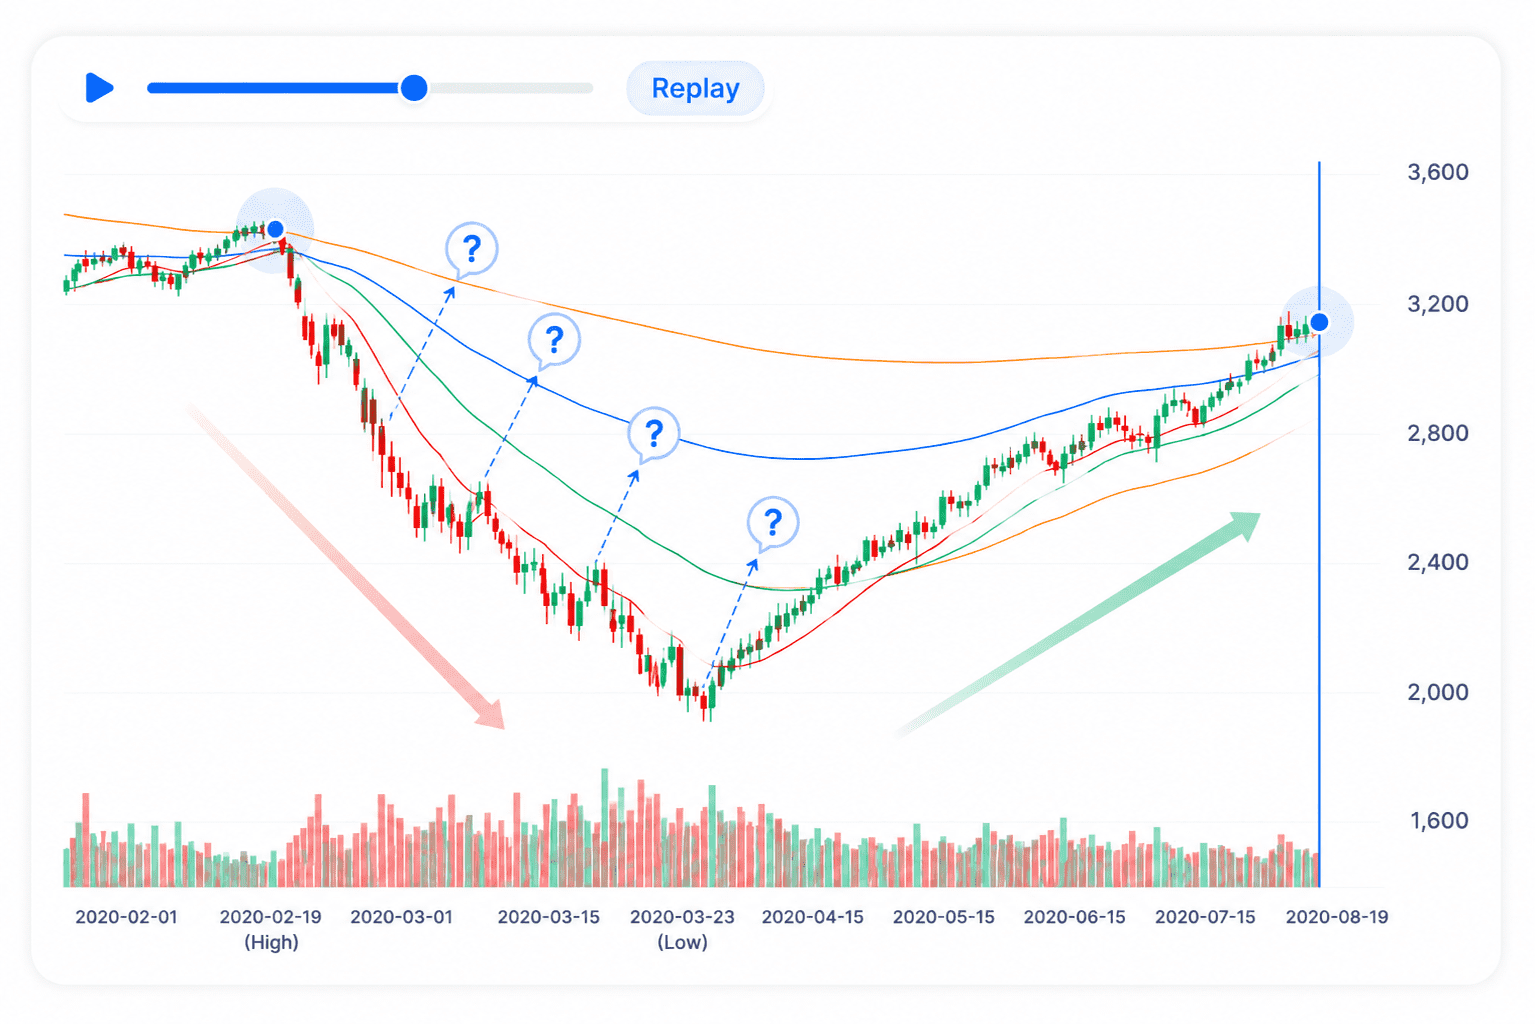
On the S&P 500, the index dropped about 34% in roughly one month, from its February 19, 2020 high to its March 23 bottom. The decline that took 2008 over a year, 2020 pulled off in a single month—an extraordinarily fast crash. And the recovery was just as fast: by around August, some five months later, the drop had been almost entirely erased.
What this short-form crash trains is the feeling of "it's so fast you end up doing nothing." In a market that moves several percent in a day, the situation changes while you're still thinking it over. Both your entry decision and your stop decision have to be made in far less time than usual.
In ENTRIQ, you can replay the individual US stocks that moved hard in the 2020 crash and practice "can I actually make a call at this speed?" If 2008 practice is about restraint and not trying to catch the bottom too early, 2020 practice is about decision speed in a fast-moving tape. Same category—crash—but a different muscle gets trained.
What Comes into Focus When You Compare the Two
The value of practicing these two side by side is that you start to feel that crashes come in types.
| 2008 Crash | 2020 Crash | |
|---|---|---|
| Shape of decline | Long, grinding | Short, violent |
| Rough duration | About 1 year 5 months | About 1 month |
| What it trains | Restraint, patience, not bottom-fishing early | Decision speed in a fast tape |
| Trap you fall into | Buying every bounce, stopping out repeatedly | Frozen by the speed, doing nothing |
Decline figures and durations are reference values for the overall market (the index). What you actually practice on in ENTRIQ is individual US stocks, and each name moves differently.
"Crash" is one word, but some come slow and grinding and others come short and violent. Having experienced both through backtesting, when the next market break comes you can meet it with your own read—"is this a 2008-type or a 2020-type?" That's a perspective you don't get from one side alone, or from calm-market charts.
How to Stop Crash Practice from Being a One-Off
Replaying a crash once and ending on "that was scary" isn't practice. This is where journaling becomes valuable.
In ENTRIQ, you can attach a strategy tag to the virtual trades you make in a crash and record them. Tag by crash type and your own setup—"2008 / sell the rally," "2020 / fade the plunge"—and you can later review, tag by tag, "in which phase did I make what decision, and how did it turn out?" How to journal trades itself is covered in detail in How to Keep a Trading Journal with Strategy Tags.
What comes into focus over repetition isn't the win/loss number but the habit—"in which phase of a crash do I tend to make what kind of mistake?" Once you know that, you can pause for a beat when the same phase shows up live. The goal isn't to predict the next crash. It's to develop a process you can follow when one happens.
A Caveat: A Past Crash Is Not "the Answer"
One important thing to close on.
Practicing on past crash charts is, above all, a way to repeat and observe your own decisions. "2008 bottomed right here, so I'll buy here next time too" is hindsight—it isn't the point of practice, and there's no guarantee it works the same way in the next crash. Every crash differs in cause, in price action, and in how it recovers.
What backtesting trains isn't memorizing a specific answer; it's the ability to make a decision when the future is hidden, and then review that decision. That ability carries over no matter what shape the next crash takes.
FAQ
Q. Is there any point in practicing crashes on past charts? A. Yes. Crashes hit live markets only once every few years, so you can't build experience from the real thing alone. On past charts you can replay the same crash as many times as you want, and because it runs on virtual capital, you can drill decisions without real losses.
Q. Can I practice the S&P 500 index itself in ENTRIQ? A. The decline figures and durations cited here are reference values for the overall market (the index). What you practice on in ENTRIQ is individual US stocks—you replay names that moved hard during the crash and practice your decisions on them.
Q. Do 2008 and 2020 mean different things to practice? A. Yes. 2008 is the long, grinding type, where the focus is restraint and not trying to catch the bottom too early; 2020 is the short, violent type, where the focus is decision speed in a fast tape. Doing both lets you feel the difference between crash types.
Q. What's the single most important thing to watch in crash practice? A. Not the win/loss number, but the habit—"in which phase of a crash do I tend to make what kind of mistake?" Record it with strategy tags and review, and the patterns you tend to fall into start to surface.
Q. Can I practice Japanese-stock crashes too? A. As of this writing, ENTRIQ supports US equities, FX, commodities, and crypto (Japanese stocks are not supported). When Japanese stocks are added, we plan to cover a Japanese-stock practice guide separately.
This article explains methods for backtesting and trade practice. It does not recommend any specific security or trading method, nor does it guarantee future price movements or profits. The decline figures and durations in this article are reference values for the overall market, based on publicly available information from the cited sources. All investment decisions are made on your own responsibility.
Reproduce this validation yourself
With ENTRIQ's chart replay, you can trade through past charts using the same rules.
Start 14-day free trialValidate your method on past charts
The same validation in this article can be reproduced with your own method. On past charts, do the classics really work?
- ✓ Replay past charts
- ✓ AI feedback on your trades
- ✓ Validate methods with statistics